With last week’s nanoparticles, Dr. Andresen and I decided to focus on citrate for now and start coating citrate AuNPs with a polymer. The reason we do this is that citrate is negatively charged, which is the same as DNA. Coating the particles with a positively charged polymer such as polyallylamine hydrochloride creates an opposite charge for the DNA to cling to when we begin to wrap it. I started this week by attempting to coat the particles with the polymer. To do this, I made a sample of polymer dissolved in a solution of 10mM NaCl so that the polymer’s concentration was 10 mg/mL. I then made a ratio of 10:2:1 of citrate AuNPs, stock polymer solution, and 10mM NaCl. I didn’t want to waste many particles, so I only did 10mL to 2mL to 1mL each batch. Unfortunately, during this process, I contaminated one of my original citrate batches and the whole thing turned black, rendering them useless. I still had one good batch, but I also picked up a new batch that Dr. Thompson made and used those two to make polymer coatings. Unfortunately, I failed both of my batches, with both of my samples in each batch looking horrible on the UV-Vis spectrum. What we are looking for is a slight redshift (shifted right towards the red side of the spectrum) that shows that the polymer has attached, as well as the same peak shape as the uncoated particles. The particles will obviously get a little bigger when coated with something, so if there’s no redshift, the particles haven’t been coated. When I finally got to the third attempt, the data looked decent. I was starting to see progress, but they still weren’t great particles. At this point, I decided to try a new method from a scientific paper that someone did that was related to my topic. After trying this and collecting the results, it turns out that the new method is even worse than my original one, so I’m sticking to the old fashioned way. I also was able to make the absorption graphs in python after some tinkering with the code, and I normalized the data (made the maximum value in the data set 1 and scaled everything accordingly) in order to make the redshift clearer.
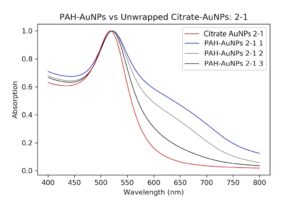 |
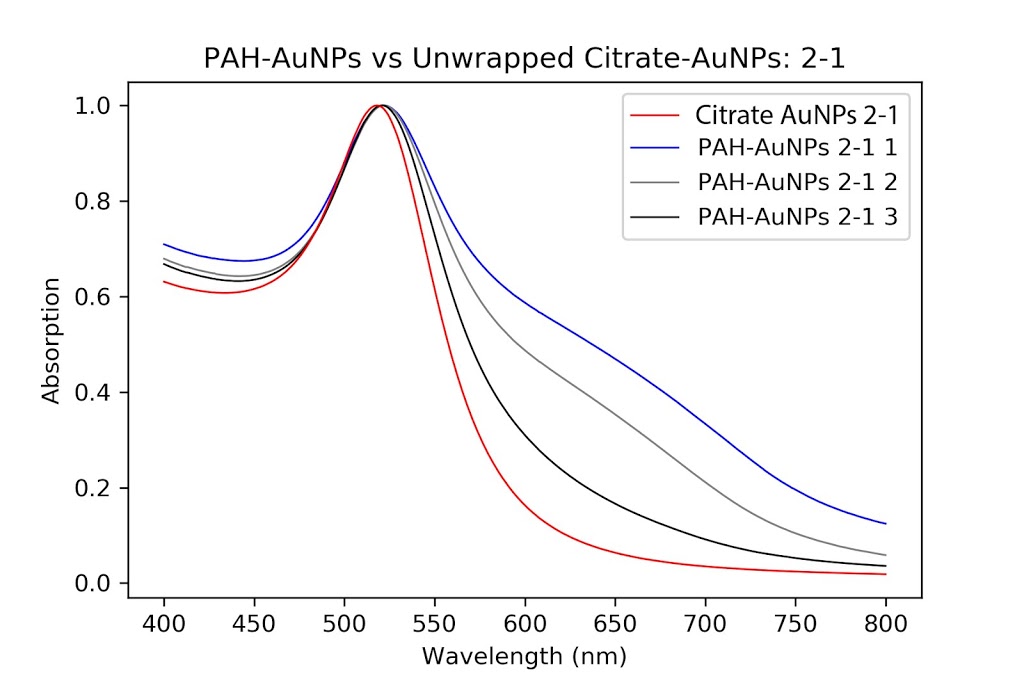
| PAH-Cit AuNPs compared to their original unwrapped citrate AuNPs sample 2-1 (the red line). The blue line shows complete aggregation and is not a good set of data. As time went on, however, the method became muscle memory and the blue to grey to black lines show this progression. There is a slight redshift that occurs, which indicates growth. |
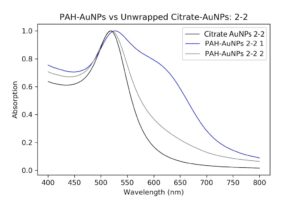 |
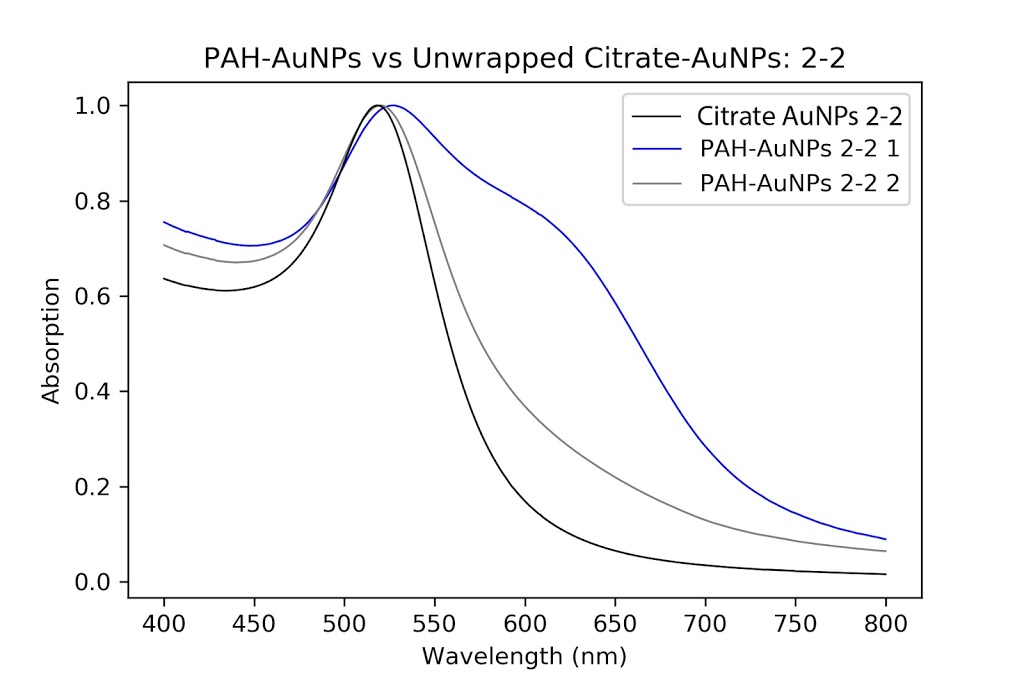
| PAH-Cit AuNPs in the second batch compared to the original unwrapped citrate AuNPs sample 2-2 (the black line). The same pattern is clear here as well. |
After a decently successful UV-Vis characterization, I went on to review the size DLS and zeta potential measurements. The size DLS was terrible overall, with all of my bad particles showing double peaks which indicate polydispersity (not all the particles are the same size). My good particles showed double peaks as well, however, I wasn’t worried due to intensity (the y-axis on the graphs) being related to size as a factor of 10^6. This means that even though the peaks look relatively the same, the peak that shows particles with a bigger size is scaled up enormously.
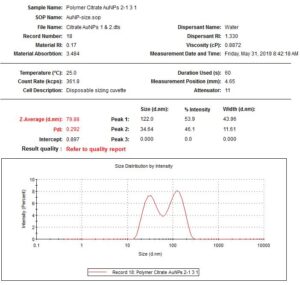 |
| PAH-Cit AuNPs sample 2-1 3 size DLS results. The graph shows double peaking at 34 nm and 122 nm, however, almost all of the particles are around 34 nm, which is to be expected since the polymer layer only adds a few nanometers to the particle’s diameter. |
The zeta potential results for all of the particles were good, anywhere from 30 to 40 mV. Since they are positively charged now, it means the coating went well. However, this does not give any indication of how monodisperse the particles are, so even the bad particles had a good charge. Next week, I am finally going to start to coat my particles with DNA. I don’t have very many particles left after all my tests, so I’ll make some new ones to wrap. Hopefully it all goes well.