


The goal of the first week was to become familiar with GROMACS, the program used to computationally simulate processes of nucleic acids, and successfully simulate research with familiar results. After general tutorials and practices, I recreated part of the experiment done by Jejoong Yoo and Aleksei Aksimentiev in 2012 (“Competitive Binding of Cations to Duplex DNA Revealed through Molecular Dynamics Simulations”), where they added +1, +2, and -1 ions (Na, Mg, and Cl) to DNA in a box of water. The goal of these simulations is to first find the bulk concentration (the base number of ions surrounding the DNA) of each ion, and then the bound concentration. The bound concentration is found using radial integration of sections surrounding the DNA, and tells us how many ions cluster around the DNA.
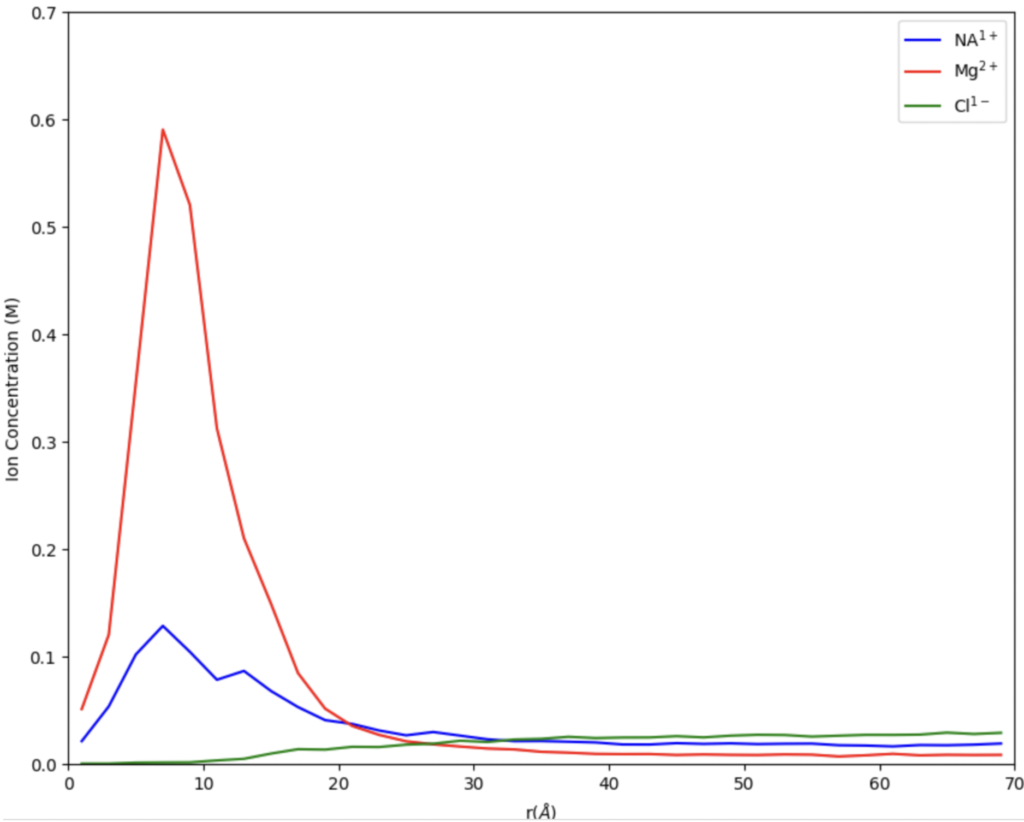
In Figure 1, we can see the bulk concentration where the concentration levels out around 25 A. The bound concentration is the area under the peaks. The graphs visualize the gathering of ions around the edge of the DNA. In this example, we can see that when there are equal amounts of Mg and Na, there is a significantly larger amount of magnesium clustered around the edge of the DNA. However, the next part of the experiment that I emulated was increasing the amount of sodium a significant more amount than the magnesium, which produced different results.
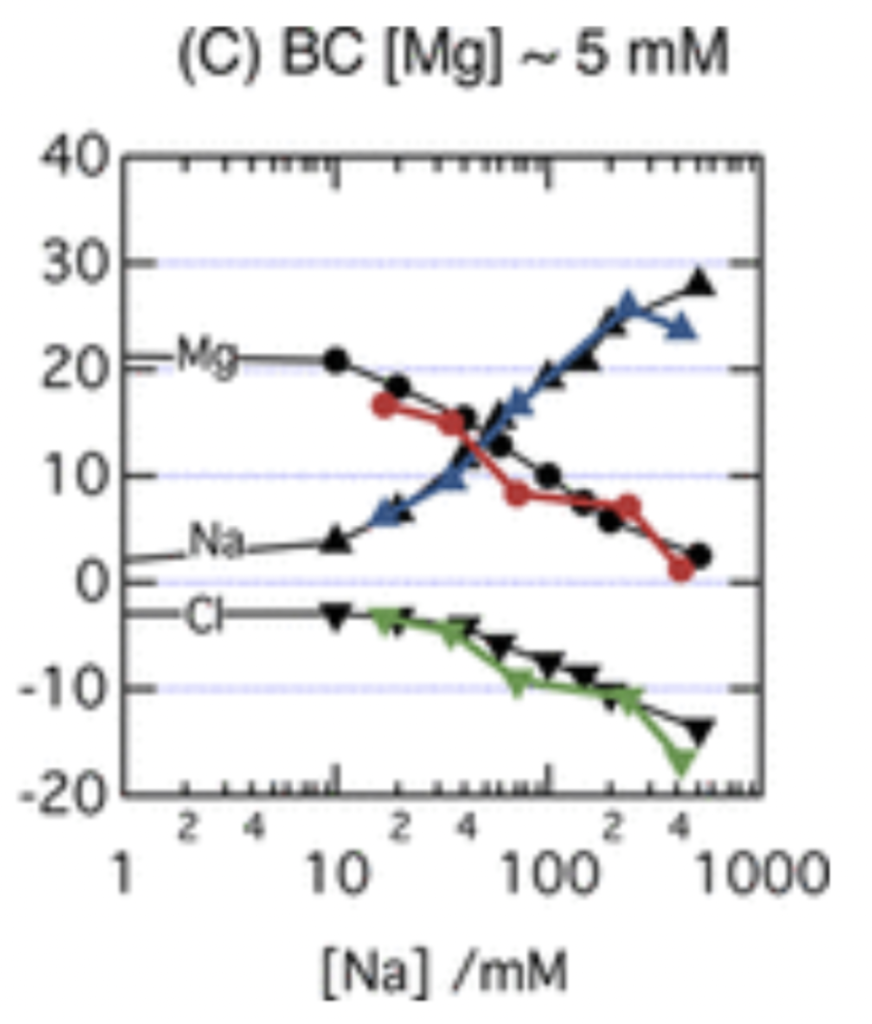
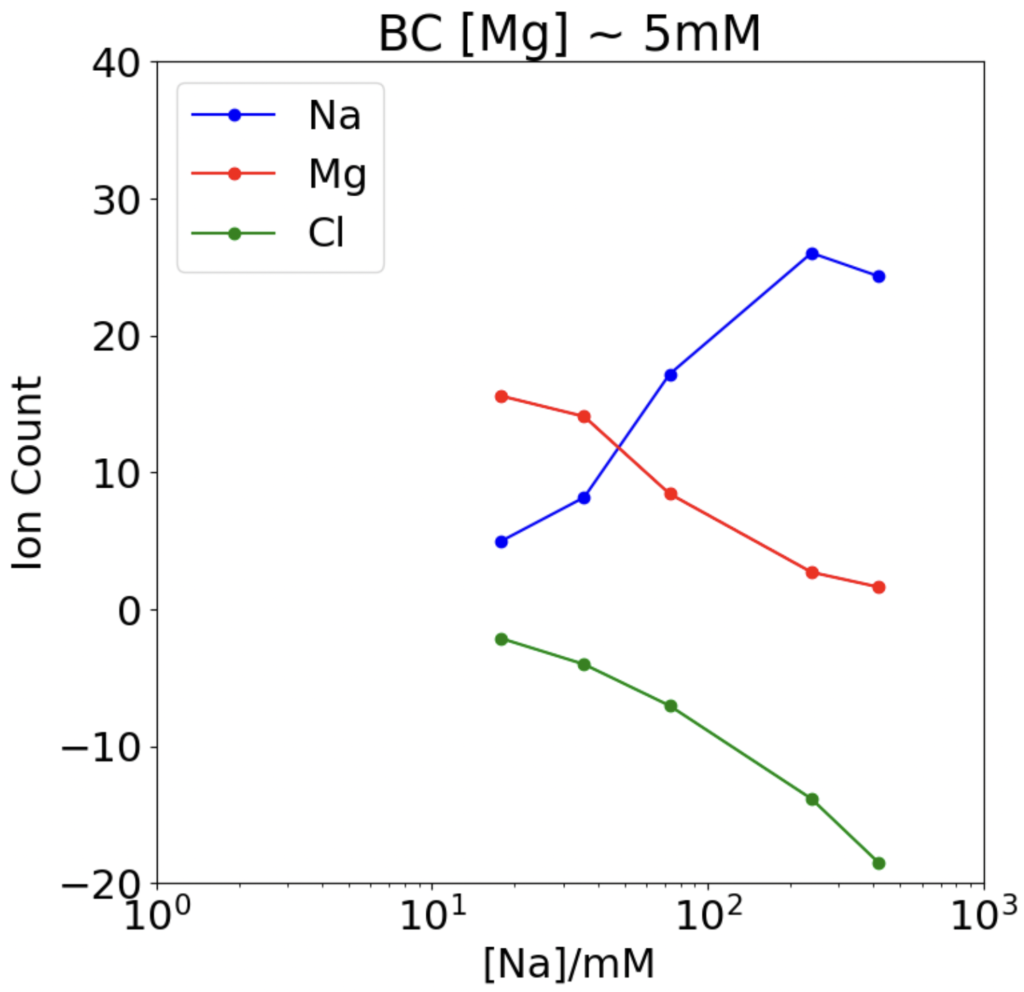
Analyzing the graphs and the data points of Figures 2 and 3, we find that sodium and magnesium/chlorine have an inversely proportional relationship; as we increase the sodium concentration, the magnesium and chlorine charge decreases. This shows the “competition” aspect; when sodium increases, it pushes other ions away from the DNA. Comparing the figures, we can see that our simulation data matches the study’s results, which shows that we completed the simulations correctly and can trust our results. Now that we know how to simulate these processes accurately, we can move on to unfamiliar research.