


Hi everyone! My name is Danielle and I’m working with Dr. Andresen on modeling DNA binding and condensation. In the past few years, I’ve been working with the isothermal titration calorimeter, or ITC, which I wrote about here and here. For the first few weeks of this summer my goal has been to collect more ITC data and to write a python script to fit the data. Fortunately, these pursuits have been going very well!

If you read my previous posts, then you’ll notice a major difference with the above picture. That difference is the presence of a second peak, representing the condensation phase of the binding process. What this means is that the DNA first binds to the ligand, (the injected solution—in this case, cobalt hexamine) then when the concentration of ligand increases to a certain point, the DNA condenses into a smaller, more energetically favorable shape.
While this is certainly very interesting, it provides a significant challenge to model mathematically. Fortunately a model was created for this very situation by Kim et al. [1] The equations, shown below, are very complicated so I won’t go into how they work too much here.


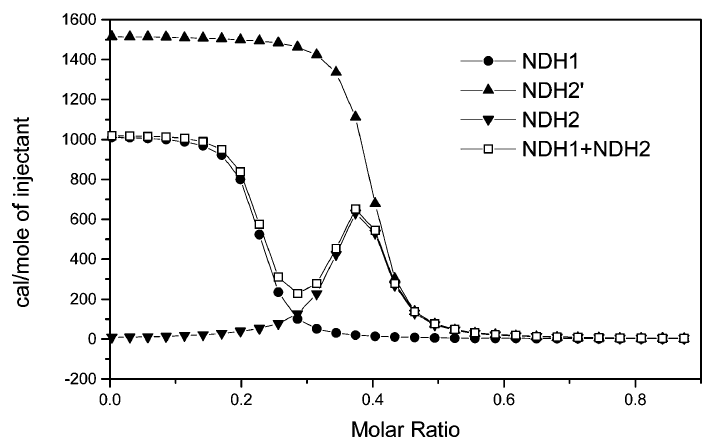
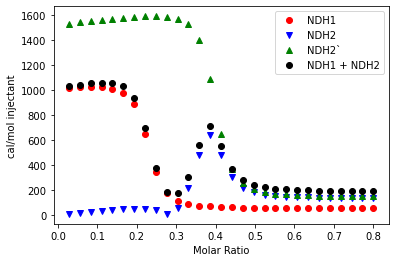
On top of these long equations, the fitting process itself is very complicated. We actually have to add up multiple NDH functions before we can fit the parameters. The first of these, NDH1, gives us the parameters N1, K1,and ΔH1 and fits the first binding stage. The second function, NDH2, describes the second binding stage and is composed of multiple other functions. This gives us the parameters N2 = N2‘ – N3, K2,and ΔH2. Finally, we add up NDH1 and NDH2 and fit the parameters with that function. In the end, this means we’re fitting 7 variables simultaneously!
This has meant a lot of programming in the past few weeks. The first step was to recreate a graph from Kim et al. to make sure that the model function actually worked. It took a while, but I was eventually able to get it to work.
Once I got this part to work, things were relatively straightforward. One week, two data fitting packages, and many, many mistakes later, I was able to get 100 lines of code that can (theoretically) fit any set of double-peaked ITC data. My next steps are going to be doing some version control with Git, adding more features to my fitting function, and cleaning up my code. Hopefully, I’ll have a fully functional python script on GitHub by the end of the summer, if not sooner!
Sources
- Kim et al. “Development of a Fitting Model Suitable for the Isothermal Titration Calorimetric Curve of DNA with Cationic Ligands.” The Journal of Physical Chemistry. 110, no. 22 (2006): 10919–25. https://doi.org/10.1021/jp057554e.