Week #1: The Nano ITC

This week I’ve been spending a lot of time working with the Nano ITC, so I thought I’d take some time to explain a bit about how it works. After all, this is what I’ll be using all summer!

Image
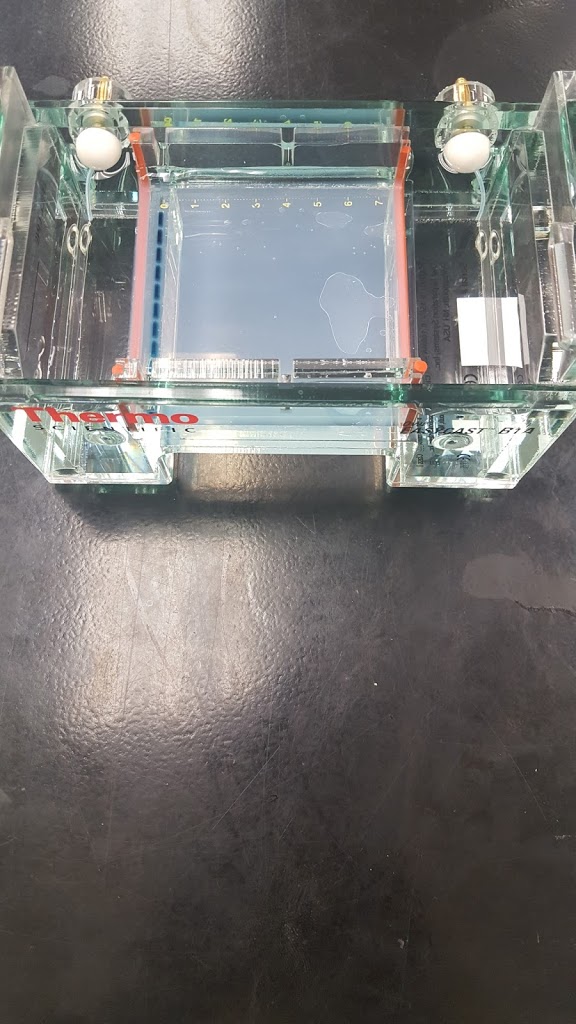
Thar she blows! The Nano ITC in all its glory!

The Nano ITC, which stands for Nano Isothermal Titration Calorimeter, is a fun little box that can tell us all sorts of things about chemical reactions. In understanding what this instrument does, I find it useful to break things down word by word. First up is “Nano,” which means it’s pretty small. In fact, the ITC only uses about 350 microliters of sample per trial. That’s about .0006 times the size of a Venti cappuccino at Starbucks! This lets us use a lot less sample to get the same information.

Image
A view down the barrel of the ITC. At the bottom you can see the openings of the two chambers. The one in the center holds our sample and the one on the right holds our reference.

The second word in the name is “Isothermal,” literally meaning “same temperature,” which is exactly how the ITC works. Inside this box of wonder are two chambers, which are held at the same temperature throughout the experiment. As the temperature of our sample changes, it is checked against a reference solution placed in the other chamber, and the machine adjusts its temperature so the two match. The ITC measures the amount of power it takes to keep these two chambers at the same temperature, which gives us our results.

Image
This is the syringe that the ITC uses to inject one of our solutions into the other.

The third word in the name is “Titration.” This is a fancy chemistry word that basically means we’re adding one chemical to another. The ITC uses a syringe to slowly inject small amounts of a solution into our sample. This causes a chemical reaction which we can collect data about. Also, we don’t actually have to do anything after we start the machine, since the ITC does it for us! Finally, we have “Calorimeter.” This just means that the ITC measures information about the thermodynamics of whatever chemical reaction is happening in the machine.
Putting all this information together, we see that the Nano ITC is a device that lets us measure thermodynamic data about a chemical reaction between two solutions. It does this by measuring the power it takes to keep our sample and a reference at the same temperature, and it doesn’t even need that much solution to do it! And there you have it! That’s a basic run-down of the Nano ITC. It’s a really powerful tool that can give us a ton of useful information. Hope you liked the explanation, and I’ll be back next week with some results from this week’s testing!

First Week – Creating Nanoparticles

This week I started making gold nanoparticles (NPs) using two different methods, using citrate and CTAB surface coatings. The first is very easy to make, simply by heating up a gold solution until it boils and injecting trisodium citrate into it. This makes a red colored solution which contains the nanoparticles. The second method is much harder. The first step is preparing a “seed” solution that contains very small nanoparticles and then scaling these up in order to become bigger and easier to work with. Once the seeds have been made, they must sit for a few hours to grow and then the particles can be made by adding the seeds to a mixture of a gold solution, silver nitrate, and ascorbic acid. This is a very sensitive process, especially when adding the silver nitrate and ascorbic acid and can be messed up easily, which is what makes it difficult. However, if made correctly, the particles will be coated in CTAB and should be a red/pink color. The ones I made this week (two batches of 8 samples each) were relatively red/pink, but a few samples were purple/blue, which indicates aggregation (some of the particles have clumped together). This isn’t what I want, as I want the particles to be as separate as possible in order to continue with my work wrapping DNA around each particle. If the particles are clumped, the DNA won’t be long enough to wrap around and will cause problems with my experiments. I also made two batches of citrate-coated particles, which look a little redder than the CTAB ones.

Citrate-coated NPs. The middle is a nice red color, but the others are an ugly dark purple which indicates aggregation of particles.

When I ran my samples through the UV-Vis machine, which measures the absorption spectrum of the particles (how much of each color in the visible light spectrum is absorbed by the solution), most seemed decent, with a good solid peak of about 530 nanometers. This means that the particles are mostly absorbing green light / reflecting red light, which explains why the solution looks red. I had a few that absorbed way too much of other colors, so I’m not going to be using them to continue my research.

Absorption Spectrum from the first batch of CTAB-coated NPs.

I also ran my samples through a DLS machine which measures the size of the particles. Most of them were around 40 nanometers in diameter, which is a little on the large side, but it’ll still work – I’ll just have to correct for this when measuring how long the DNA should be. I had a few that were way too large, so I won’t use these either.

The last analysis that I did is called zeta potential, and this basically measures the charge on the surface on the particles. Almost all of my particles performed well in this test and had the correct charge on their surface (about 30 millivolts). This is all well, however, the most important test is the absorption spectrum measurement, so all of the ones that did not do well in that test I will most likely be trashing. Next week, I’ll start wrapping DNA around my particles and hope that all goes well – if not, I may need to create new particles.

Last Week

So last week Monday morning came around and Professor Thompson had been too busy to prepare gold nano-particles for me. This was fine, I was ready to tackle the task on my own. The procedure involves bringing 100mL of a solution up to a boil and then pouring 3mL of another solution into it. The solution then proceeds to change colors several times, its actually pretty neat to watch. I ended up making a pretty concentrated batch of nano-particles. It even ended looking pretty good under the UV-Vis, so I decided to continue on with my project using them. I needed to find a good ratio of NPs and PAH because the two are pretty fragile. If not mixed together properly they can immediately aggregate and make the solution unusable. Also, if they are not in the proper ratio this can also cause it to become aggregated and then unusable. So I tried to make a 3x and a 5x diluted NPs solution with normal concentrations of PAH. Both seemed usable after mixing. I then tried out the new cleaning procedure that Professor Thompson had suggested. I would spin the solutions at very high speeds, 9000 rxg and 7000 rxg in order to get all of the excess PAH out of the solution. This maximized our risk of contamination by stray PAH particles. My problem with this procedure arose when I had to wash the pellets with DNA in them. After I started this centrifugal process, I found that the solutions were creating pellets that were virtually non-existent. This is not good, as it is one of our main goals to get good pellets here. I was thinking that these pellets could not form because I had diluted the initial amount of NPs in the beginning. Professor Thompson suggested it had something to do with my spinning procedure for the DNA washes. I’m now currently trying this new procedure, which includes longer times and a larger rxg, to get better pellets in my solutions.

Continuation of Week 6

Is finally Friday! Well that doesn’t matter, what matter is what I have accomplish this week. In terms of work, I have accomplish  a great deal but in terms of progress I could had accomplish more. I say this because we got our results from Monday and we didn’t get the results we wanted… again. This is really frustrating but like I said last time, researching is about learning from our mistakes and improving upon them even if it takes multiple failures. Once we saw our results, professor Andresen and I came out with a new method to try out it order to see if we were doing our trial digestion correctly. Instead of using our chromatin, we instead used sonicated DNA with our trial digestion to see if we get different results in our gel. In order to do this we must first shred DNA and we would be left with a solution of liquid DNA.Then I added 50 micro-liters of sonicated DNA into two micro-centrifuge test tubes. Once this was done, I diluted the micrococcal nuclease to 100x dilution and also diluted CaC12 in order to add to our two samples. I added 0.5 micro-liters of micrococcal nuclease to one sample and to the other sample I added 2.5 in order to have two different lengths of DNA. Once this was done, I put both solutions in the heater for 15 minutes at 37 degrees Celsius and when this was done I did the same procedure as the previous trial digestions. In the end had two different samples to test in our gel, but I also made some extra samples such as DNA ladder and just the shredded DNA and the same samples with just added DI water. I added this solutions into our gel,  and when the results were ready, we again got the results which was more frustrated because it still didn’t work. The results can be seen in the next picture. Figure #1

Figure #1: Results from Gel

From this picture, we can clearly see that we can’t  see any base pairs from our samples, only from our DNA ladder which is located to the left. This is the problem that we have been getting on our past trials and from this picture, we think that all of our samples are staying in the beginning of gel. In other words our micrococcal nuclease is not separating our chromosomes.
After this process was done, professor andresen and I decided to do one more trial with the past solutions but this time, instead of making 3% agarose gel, we will be making 1% gel. What this would do, it would make us see the base pairs stuck at the top of gel from the previous samples. For this new trial, I will use two samples with out the proteinase K trial digestion and two other samples with the full trial digestion. Unfortunately when I was moving the agarose gel to the special the machine that was gonna give me my results, the gel felt apart and what this meant was that I needed to redo my work all over again. which I eventually did.
The next day I ran the gel and while I was waiting for the gel to be done I prepared another trial digestion that I will do next week. This new trial digestion consisted of time intervals of 5, 10, 20, 40, and 60 minutes and 1.6 micro-liters of 100x diluted micrococcal nuclease.
Once the gel was done, I look at the results and they were a little better than previous results but it still didn’t show the base pairs that we want it to see. We are hoping that next week with this new trial digestion, we will be able to see the results we want to see. Its a struggle keep seeing how our trials always fail but even though its slowly, we are making progress and we will be able to find what is causing our results.

End week six

The last run of samples was supposed to be our most promising samples yet. It had looked like we were going to get not only quality data but in a large quantity as well. Unfortunately, something had gone awry. When we start with out citrate nano-particles they should be negative in charge, then we wrap them in PAH and they switch to positive charge, and then finally we wrap them in DNA and they switch charges a final time, back to negative. My first two Zeta tests were conclusive and yielded the expected results, however the final one simply doubled the number and did not switch the charge at all. Professor Andresen phoned a friend and we then scheduled a conference with Professor Thompson. Before we could have this conference however, I first had to prepare a power point presentation on my most recent bit of research. Dr. Thompson broke down several of the data pieces I am so accustomed to collecting and helped me better understand them. The UV-Vis is a lot more helpful then I know it to be, but I really need to learn how to overlay graphs on it, I am determined to learn this early next week when I have to use the machine again. The conference left me feeling very hopeful about the project. On Monday Professor Thompson is going to prepare more nanoparticles for me to use in my next batch of samples. He also suggested a much more appropriate way of preparing the PAH wrap and how to more properly purify them. I am hopeful that this will greatly improve the project. At the end of this week, I am wrapping it up by shearing DNA and looking forward to finally getting proper data next week.

Week six

So at my last post I had just found an appropriate mix of salts and nano-particles. This allowed me to then mix in my DNA and start performing equilibrium dialysis. However, I immediately ran into another big problem. What was I to re hydrate my solutions with? In the past, at this step I was not using citrate nanoparticles, but I was re hydrating with TEM buffer. I was uncertain if this would be efficient with these new particles. I decided to head to the science center and discus this problem with Rich, a fellow user of similar nano-particles. We threw a few ideas back in forth, but nothing seemed like an exceptionally good idea to re hydrate with. So I had to make a sacrifice, I gave up any hope of getting to use the ICP-OES this run in order to figure out what to re hydrate my samples with. I split my total solution of nano particles into three parts, one would be re hydrated  with mili-Q, another with TEM buffer, and a third with a solution that was 10^-2 M NaCl. Unfortunately I was only re hydrating with 4mL each when I typically do double that. Regardless, the results appeared to be conclusive, showing that the salt buffer worked the best.

So then I had to restart once again. This time, I took all of my gold nano particles and coated them with PAH. I then spun them in the centrifuge for an increasingly long period of time to siphon out the supernatant and continue spinning that. Finally, I recombined the pellets and diluted it back to 7mL with more nano particles. So I’m left with 1 super concentrated gold nano particle sample and 7 other slightly less concentrated samples. They were then all mixed with DNA and left to sit over night. Now I am currently trying to perform equilibrium dialysis, and hopefully after doing this I’ll finally be able to use the ICP-OES.

End of fifth week already?

Time surely flies by when you’re working full on. This week, I started working on another batch of ITC experiments after we figured out a number of flaws in our experimental protocols. Therefore, we decided to redo some of our previous experiments using different experimental parameters and protocols.
We decided that we would keep the relative concentrations of DNA and Cobalt Hexammine unaltered in the different ITC runs. The concentrations of DNA and Cobalt Hexammine used in the experiments were 2.5mM DNA+3mM Cobalt Hexammine, 5mM DNA+6mM Cobalt Hexammine, 10mM DNA+12mM Cobalt Hexammine. In addition, we decided to alter the experimental procedure a tad bit. We decided to form isotonic DNA+NaCl solutions using the dialysis method so that the concentrations of NaCl in all the samples are equal. The dialysis buffer was used for the serial dilution of the 120mM stock Cobalt Hexammine (instead of water as in the previous experiments).

After I prepared the batch of DNA samples (of different concentrations) using the regular method, I filled up dialysis tubes with 10ml of each sample. I left the tubes in a dialysis buffer of 10mM NaCl solution overnight. I used the same dialysis buffer for the serial dilution of the 120mM stock of Cobalt Hexammine in order to synthesize 10ml of 12mM,6mM and 3mM solutions respectively.

After the synthesis of the DNA samples and the Cobalt Hexammine solutions, I ran heat of dilution tests on the Cobalt Hexammine samples. Here are the results:

After running the heat of dilution experiments, I proceeded to start ITC runs with my DNA samples. I started off by using my 10mM DNA sample. Here’s the overlay for the raw heat data and the integrated heat data:
That’s all the highlights from week 5 folks. Stay tuned for more ITC results next week!

6th week, New trial digestion with some changes.

Wow! it’s the sixth week, seems like time never stops and always keeps moving. Well today is a Monday, which are never a good feeling but we gotta hang in there. I started my day by going over the results with Professor Andresen, in order to come out with a solution or a new procedure. Eventually professor Andresen did came out with a new procedure which is the same procedure has before but with slightly different trial digestion. Instead of creating different samples of our solution by adding different amounts of micrococcal nuclease, we instead only made two  50 micro-liters of solution which contain different amounts of micrococcal nuclease. I places this solutions into the heater for 37 degrees Celsius and took out 5 micro-liters of each solution at a specific time. The different times that we assigned were 5, 20, and 40 minutes, with another sample that lasted about 2 hours. This procedure accomplished the task of creating different sizes of DNA  by letting the microccocal nuclease eat up the nucleic acids and taking small amounts of sample at different times and stopping the process by adding EDTA. Once this process was finish, I continued the trial digestion with the same procedure as before by using proteinase K and SDS. In the mean while, I created a new gel in order to put the trials in tomorrow. I also made more TBE buffer to used the next day. All this procedure took approximately the whole day due to the unfortunately broken wrist I got. All is well and I could still work, and that’s really important to me because I never give up on something I start.

Final day of Week #5. Finally able to see Results

Its Friday! It is always good to come to work on a Friday because you feel at easy with yourself and work just for the fact that once this day is over, you can rest for two whole days.
Well I started my day out by making more TBE buffer, which consist of 50 ml of TBE (Tris-Borate-EDTA buffer) and 450 ml of DI water. Once I was done making this buffer I made two DNA ladder, DNA ladder is a solution of DNA molecules of different known lengths and is used to run along side our samples in order to estimate the size of our samples. Once this was done, I prepared an extra micro-centrifuge tube with only 1 micro-liter of our chromatic supernatant, 9 micro-liters of 60% sucrose and 10 micro-liters of DI water. I made this extra sample in order to see how it looks on the gel without the trial digestion. For the solutions who already had already been through the trial digestion, I took 1 micro-liter from each and added them to new micro-centrifuge test tubes with the same numbers label in order to not get mix up. I also added 9 micro-liters of 60% sucrose and 10 micro-liters of DI water to the new test tubes. Once this was done I was ready to add them into my gel. The solutions on the gel can be seen in figure #1.

Figure #1 Samples added to Gel

Once I loaded all of my samples into the gel, I set the voltage to 100 volts and waiting until a blue line reached 5 cm. While I was waiting for this process to happen, I started to unpack all of the materials that we ordered in order to have more stock available to used in the future. It was like Christmas morning, unpacking all of the boxes. See figure #2 

Figure # 2 Material needed for present and future usage

Once the unpacking was done, our shelves finally looked like they had material in it and it looks awesome. See figure #3

Figure #3 More beakers to make more Buffer

When all of this was done and my gel was finally done, I took the gel and used a special UV light to the results. Unfortunately once again we didn’t get the results we wanted. After I saw my results, I felt disappointed because I had worked so hard to get better results than last time but that didn’t change the outcome. Like I said before in previous blogs, being a researcher is about working hard and trying to solve problems even if it means failing multiple times. It is hard to accept the results but my results just show me that I must work harder and try again until I get the results I want.