Centrifuging and Washing DNA

If you remember from my last blog post, we were about to embark on a new journey. After collecting a lot of data on zinc and what it does to DNA, we want to see if this change is reversible or not. Does the zinc bind so tightly that it cannot be washed away? Answering this question is what I’ve been up to this week. In order to do this, we took some samples of DNA in a 300mM zinc solution, and tried to get all the zinc out via centrifuge. We put the samples through a special filter that lets everything but DNA pass through, and then we add NaCl, MgCl2, and Tris buffer five times, running them through the centrifuge each time. After this was all done, I ran the samples through the CD spectroscopy machine, so we could see any changes in the DNA structure.

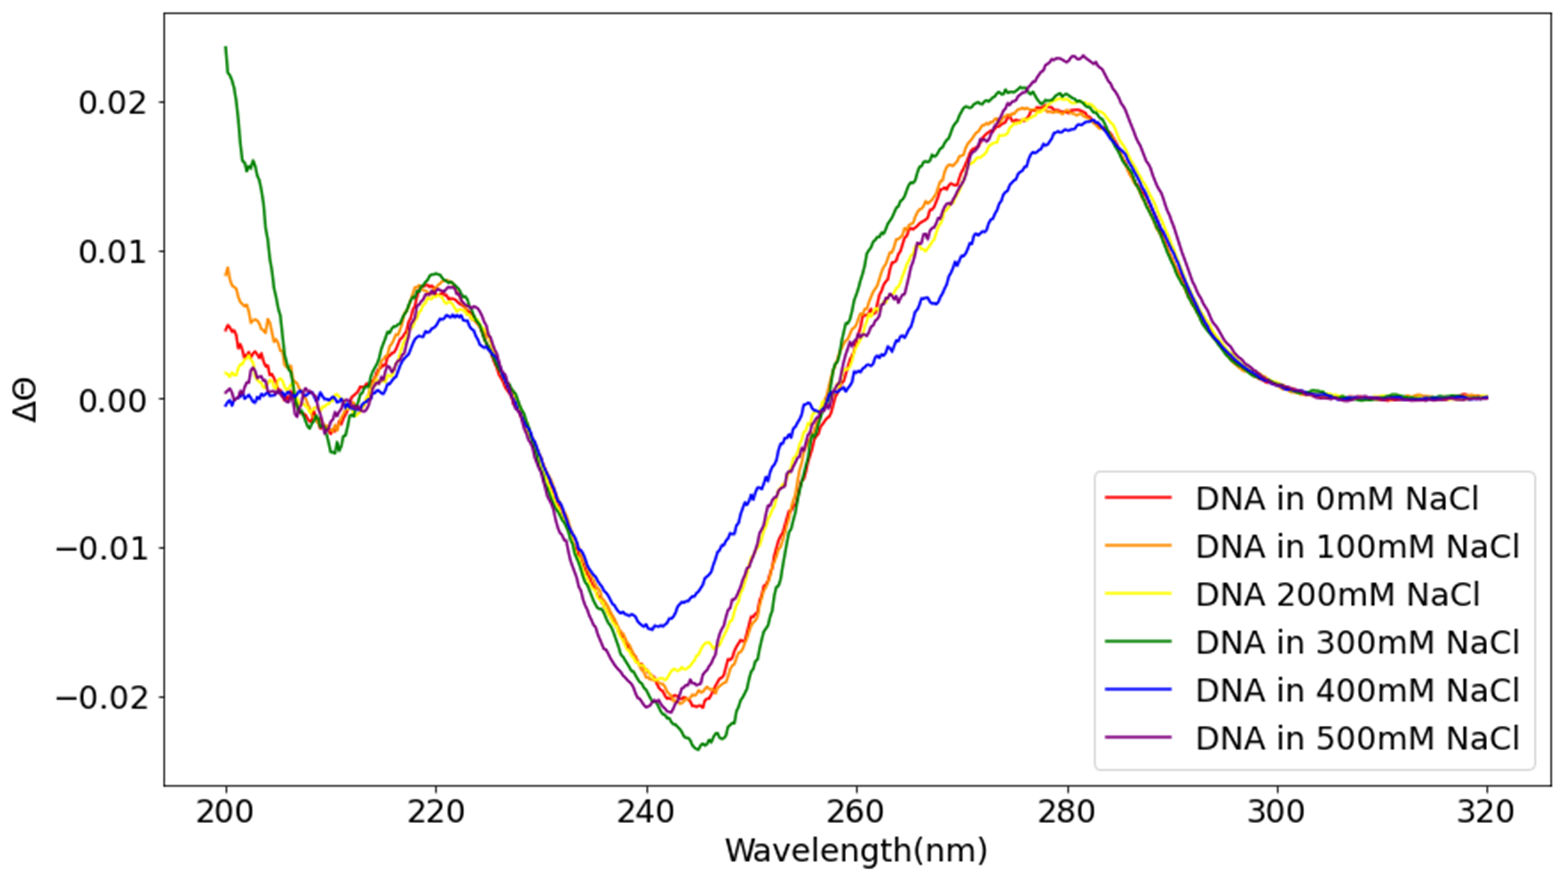
This is our latest graph, and we can see that DNA that has been washed with salts and a buffer looks very different from DNA in zinc solution that has not been washed. We can interpret this as the zinc unbinding from the DNA, which makes the peak at 275 nm revert back to how it was before zinc was added. However, we can still see some differences between the washed and unwashed DNA. The through at 245 nm is greater for the washed solutions, but is very similar for the DNA in plain water, and the DNA in zinc.

I am currently in the process of redoing this whole experiment. I hope that the new graphs will corroborate the data that I have already acquired, and help me analyze more accurately the differences between washed and unwashed DNA. Until then, I do think that we have some promising data, and I look forward to elaborate more on this experiment.

Making Samples, Graphs, and Reading Data

What have we been up to? For starters, the project about measuring Zn2+ binding to DNA has really taken off. We started by doing some samples of DNA in NaCl and MgCl2, which you might remember from our previous blog post. We did those several times to try to get some results that showed a change in the DNA structure. We ran all of our samples in the CD spectroscopy instrument, which measures how long it takes for DNA to unwrap. This time, we measured over the right span (320 nm to 200 nm), which means we can now read our data!

 What we wanted from these graphs was to observe a difference in the magnitude of the peak and trough of the graph, which was proportional to the sodium and magnesium concentration. In these graphs, it is possible to see that the concentration of the sodium and magnesium is directly proportional to the change in the DNA, however, we do have some outliers. Nonetheless, we decided we were ready to move on to the next step of the project, measuring the effects of zinc binding to DNA. We made two sets of similar Zinc and Magnesium samples, with varying concentrations, with the hopes of getting similar (but better) results to the ones above. We are doing both zinc and magnesium samples in order to compare the changes, to see if it’s the +2 charged ions that is causing the change, or the zinc itself. Then, we will do it all over again until we have a significant batch of good data.

We will also be looking to see if this change is reversible, or if the zinc binds so tightly to the DNA that it cannot be washed away. This will be achieved by exposing the DNA to zinc and later washing it with Tris, NaCl, and MgCl2.

Here are our latest results, which look very promising! We also learned a very handy tool to make our graphs look better and more accurate. By normalizing the line of each sample with the experimentally measured concentration of the sample, we are able to get rid of any variation read by the CD that comes with human error when making the samples.

First Week Update!

Hello everyone! Andresen Lab Crew Summer 2022 here! We are here to give you guys a rundown of our first  week of research. For starters, we are working with DNA (I know right!!). Aisha and Sofia will be collaborating on the same projects; Measuring the Kinetics of the Disassembly of Mononucleosomes and Measuring Zn2+ binding to DNA, while Tam will be independently working on The Entropy and Enthalpy of DNA systems.

The Golden Trio at Golden Hour

On our first day, we learned the basic skill of pipetting. We pipetted water in order to get a grip on the basics of pipetting before proceeding to pipette different solutions and liquids. Professor Andresen wanted us to use each pipette to measure the same amount three times, with the hopes of eventually getting a percent error below 5%.

On Tuesday we started the day by making DNA stock, which we would be using in all of our samples. We started out by measuring 0.08 grams of DNA. We put the DNA aside and pipetted (with our recently mastered pipetting skills) 7840 microliters of water into a 50mL tube. We then pipetted 80 microliters of TRIS solution and 20 microliters of EDTA solution into the tube, in order to make a TE buffer. We put the DNA in the tube and mixed it in the vortex mixer for a while, in order to break up most of the DNA. After that, to make sure the DNA was really broken up, we put it in the sonicator for several rounds. Now we had a 8mL sample of 10mg/mL of DNA, which we then diluted into a 1mg/mL sample so its concentration could be double checked in our spectrophotometer. After several rounds of checking the concentration, we got around 0.8 mg/mL, which is considerably less than what we theoretically had. However, the next morning we repeated the process and measured our concentration to be around 1mg/mL, so success!

On Wednesday, we started by mixing our DNA stock with NaCl and MgCl2 solutions. Our goal was to make 5mg/mL of DNA in different concentrations of NaCl and MgCl2. We used the formula M1V1= M2V2 (which looks the same as the momentum conservation formula) to find the amount of NaCl and MgCl2 we needed to get the right concentration for our solutions. After that, we had to dilute all of our samples by a factor of 5 because that was the concentration that our spectrophotometer can measure. Most of our results were within a reasonable range (the expected values of DNA’s concentration was 1000 ng/microLiter).

Today (Thursday), we spent the day in our collaborator, Dr, Buettner’s lab, using the CD machine to measure how long it’ll take for the DNA to unwrap, (the nucleic acid inside the DNA). After measuring all 11 of our samples, professor Andresen gave us a coding crash course, so we could start interpreting and graphing our results using Jupyter. However, we realized that we measured our DNA samples within a range that was too narrow, so we have to go back tomorrow and do it all over again. Nonetheless, we will not be taken aback by a small setback, we will come back stronger than ever tomorrow!