Black Flecks of Aggregation

I started out this week by trying to purify the DNA-NP conjugates that I made last Friday. Unfortunately, all of the samples except the 1 microgram/mL DNA sample showed significant aggregation after sitting at room temperature for the weekend. I chose to only attempt purification of that one sample but after just 2 spins in the centrifuge the sample had completely aggregated out. I tried the same concentration with slower spin speeds and longer times but the sample continued to aggregate out. Thinking that perhaps the conjugates were forming histone-like aggregates, I next tried digesting the “nucleosomes” with the micrococcal nuclease, an enzyme Sarah is using to isolate mononucleosomes, and then purify them. The result was a low concentration solution with lots of black flecks of aggregation that floated in solution and resisted pelleting following extensive centrifugation.

If you look closely you can see the black flecks of aggregation

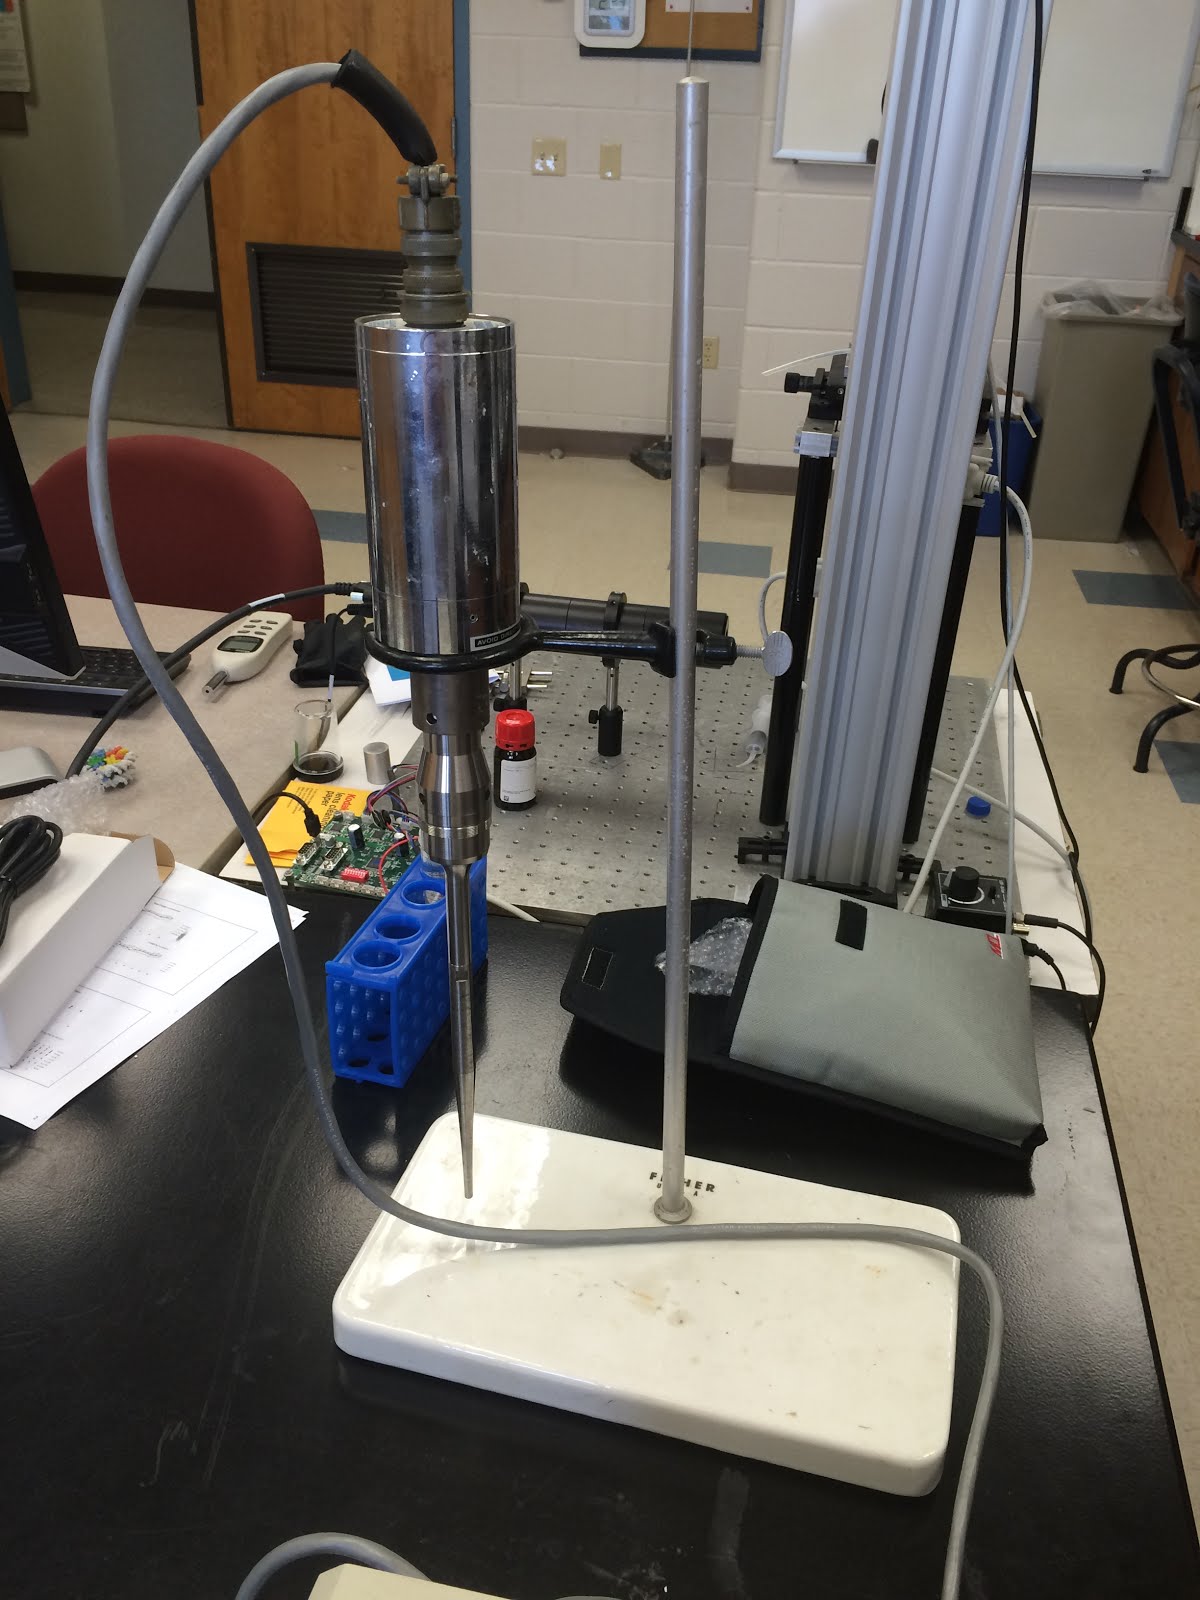
 Unfortunately in the Thompson lab, they ran out of nanoparticles and the CTAB needed to make new nanoparticles so instead I turned my focus to shearing down the calf thymus DNA using sonication so it would be less likely to incite aggregation. I had attempted this in the spring but had not had any success mostly due to the fact that I had to use a water sonicator that is not optimised for DNA shearing. The protocol called for a probe sonicator. There is only probe sonicator at Gettysburg in the Biochemistry lab and I had been told it was broken. However, with nothing else to do, we decided to take the probe sonicator and try to fix it. Turns out the sonicator was not broken, it worked just fine once we plugged it in. So I ran the shearing protocol I found in a paper I read. The sonicator is quite loud. I only ran it at level 3, but higher levels probably require ear protection.

After I ran the shearing protocol, I characterised the sheared and unsheared DNA using DLS, UV-vis, and gel electrophoresis. The gel electrophoresis showed that the DNA was sheared down from a 10 kb chain into a slew of differently sized fragments ranging from 1 kb down to much less than 0.5 kb. This data indicates that the shearing protocol was very successful in producing fragments small enough to hopefully resist aggregation.

DNA Ladder
Gel electrophoresis. The first lane is the DNA ladder, the second lane is the unsheared DNA and the last lane is the sheared DNA.

Since I learned that new CTAB cannot be obtained until the middle of July, I am considering using negatively charged citrate gold nanoparticles and wrapping them in positively charged lysine molecules before mixing them with the newly sheared DNA.

Don’t do drugs kids. Except caffeine… lots of caffeine.

Calf Thymus DNA

I started this week by cleaning and concentrating the nanoparticles that I made last week. On Wednesday I finally had my DNA to play with and I started by reconstituting it in TE buffer. The DNA I am using is a very common and cheap type of DNA extracted from a calf’s thymus. It can be anywhere from 8-15 kb in length so its too long to make it through the centrifugal filters I have used previously for the PSS. I made 10 mg/mL stocks of the DNA and passed it through a syringe to hopefully shear it some and reduce the viscosity. After I reconstituted the DNA, I titrated into some of the gold nanoparticles at concentration ranging from 0.1 micrograms/mL to 1000 micrograms/mL and measured the UV-vis spectra at each concentration (see graph below).

We noticed that there was positive shift in wavelength with increasing DNA concentration which could be an indication of the DNA wrapping. We also saw some severe aggregation starting with 10 micrograms/mL that could be an indication of the formation of some sort of superstructure arrangement of the nanoparticles on the DNA. It will be possible to confirm if such a structure exists if we are able to visualise the nanoparticles on the TEM. However, the TEM is under maintenance right now so it is hard to now for sure. One superstructure that is possible and has been the subject of a lot of literature is a model histone (see picture below) which would have interesting implications.
I made up solutions of varying concentrations between 1 microgram/mL and 10 microgram/mL and measured their spectra to find a concentration that has DNA binding but no aggregation. The spectra showed the same increase in wavelength with increasing concentration but it also showed that the wavelength actually starts decreasing between 8 micrograms/mL and 10 micrograms/mL. It also shows that 2 micrograms/mL has a noticeable shift with little to no aggregation (See graph below).
Next week. I will attempt to clean off the excess DNA and measure both the bound and unbound DNA in the solutions.

June 17th – Making Nucleosomes

                This week I began the process of making nucleosomes. On Wednesday, we received a 500 mL supply of whole chicken blood, and I started the process of purifying 50 mL of it. Because the volume is “whole” chicken blood, it contains plasma, red blood cells, and white blood cells and platelets (see the image from the American Red Cross below). Birds are unique because their red blood cells contain nucleosomes, so the first step of the procedure was to isolate those cells. Such isolation was achieved by centrifuging the samples multiple times, and achieving a separation similar to the image below. The supernatant was the plasma, which was discarded, and the white-film on top of the red blood cells was also discarded.
                The next step in the procedure was to lyse the red blood cells, thus releasing the nuclei. Again, the samples were spun in the centrifuge and after successive spins, we were left with a clean, white precipitate. Over the next few days, we will work towards isolating just the nucleosomes from the nuclei.

Color Changing Kool-aid

Its the first week of research in Summer 2016! This summer I’m working on looking at how DNA interacts with CTAB gold nanoparticles while my friend Celina in Professor Thompson’s lab continues the work with PSS coated nanoparticles that I started last summer. This week I mostly worked in Professor Thompson’s lab changing the tubing on the nanoparticle flow-reactor and attempting to make a liter of CTAB nanoparticles using it.

Flow reactor used to make up to a liter of CTAB nanoparticles at a time.

It took a few tries to get the right reactant volumes for the monodisperse nanospheres we wanted. The first batch seemed, from its properties and UV-vis, to possible contain nanocubes. These nanocubes conveyed a really interesting property to the solution that made it a rusty red color in normal light and  a violet color when held up to sunlight.

In the end we managed to make nanoparticles with a smooth UV-vis around the right wavelength and normal DLS and Zeta measurements.
                                             
Next week, I am hopefully going to get some DNA and be able to start wrapping it around the nanoparticles.
                              

First Post of 2016! June 10th, 2016

Summer research kicked-off this week for both Savannah and I, as we began to work on new experiments. I focused on two projects this week: analyzing data that Abby took during the summer of 2014, and doing preliminary reading on nucleosome core particles (NCPs). I will be working on both projects throughout the summer.
                The data Abby took in 2014 is very similar to the data I analyzed last summer, except there was ion competition between a monovalent and a trivalent cation charge neutralizing a hexagonal array of DNA (as opposed to divalent and trivalent). Abby had already computed the average concentrations of each element in the samples, and I was just compiling the data into graphs (see below). Problems with this such “raw analysis” of the data is evident though: the total cation-to-anion charge ratio easily exceeds one. This problem arises because the trivalent ion dissociates into a divalent ion in high chloride concentrations, which is not taken into account in the graphs below. But evening knowing the dissociation constant, simple chemistry cannot be done to determine the respective concentrations of the divalent and trivalent cations because trivalent ions favorably bind to DNA. Therefore, more theoretical work must be done to understand the system.
                Primarily throughout the summer, I will be working on the nucleosome core particle experiment. Last summer, Abby set the foundation by writing a procedure to make the NCPs, and doing some preliminary experiments with them. I plan to build off Abby’s work by improving the NCP procedure and doing more experiments with them. This week, I read and tried to understand her procedure, and hopefully next week I will start making the NCPs!

Agarose Gel Electrophoresis!

The past two days, we have prepared and ran 2 gels to determine the best digestion for the chromatin. I added various amounts (from  5 to 80 Worthington units/mg chromatin) of micrococcal nuclease to small samples of the chromatin solution. We made sure that the concentration of DNA in the solutions was less than 100ng/ml so that the gel would run without smudging. We mistakenly let the first gel run overnight at a low voltage but it over ran. Today we ran it through lunch until the visible blue line was at about 2.5 cm. We determined from the imaged gel that 15 Worthington units/mg chromatin of the micrococcal nuclease is sufficient. I then digested all of our chromatin and centrifuged it down. Tomorrow we will be doing a column and another gel to see if our nucleosomes are adequate to use for experiments.

Gel electrophoresis set up including the black death stuffed toy that watched to make sure our gel ran smoothly.
  

The End is Nigh

This is the last week of my summer research…

A bit dramatic but I’m doing equilibrium dialysis right now so I feel Frodo’s pain 😉

 Last week I did the nanoparticle titration with sodium chloride and found that partial aggregation occurs at 100 mM and complete aggregation occurs at 200 mM. Then I did a dialysis of pure PSS in sodium chloride concentrations up to 50 mM and ran DLS and ICP on the resultant samples. The DLS showed some weak trends that may indicate a change in the PSS conformation dependent on salt concentration. The ICP results showed no difference in the amount of Na/S at different salt concentrations.

This week I am running an equilibrium dialysis on a new batch of PSS coated nanoparticles against a few sodium concentrations up to 50 mM. I got a new dialysis system that holds 4 mL at a time so I can run the same amount of sample in fewer tubes. Each concentration has 2 tubes, one will undergo both the salt and water and the other just the salt dialysis. This way we can run DLS on the samples that still have high salt concentration while running ICP on the water dialyzed samples without having to worry about background sodium.

This week, I will only have time to do the dialysis and the complete workup for it. I’m going abroad in the fall, to Lancaster University England, but I am looking forward to continuing this research in the spring!

Preparing Nucleosomes!!

This week Professor Andresen and I have been preparing mononucleosomes from chicken erythrocytes. Hopefully by Tuesday we will have clean, pure mononucleosomes that we can then use to investigate their electrostatics. So far we have taken the nuclei out of the blood, cleaned it, digested it with micrococcal nuclease and separated the DNA/nucleosomes from the nuclei.

July 10th – Computer Simulations

Recently, I have been attempting to model DNA-ion interactions through a computer program called Delphi. After imputing atomic coordinates, atomic radii, and atomic charges files, Delphi solves the linear and non-linear Poisson-Boltzmann equations and can output the charge neutralized by the ions (can be compared to the charge of the DNA) as well as three-dimensional concentration maps.
Even more recently, I used Matlab to generate a hexagonal array of 19, 60 base pair long, DNA strands (see below). In our experiments the DNA was condensed into a hexagonal array, so these generated atomic coordinates produce a more accurate simulation of the experimental DNA-ion interactions.
Now, I will be working on adjusting parameters in Delphi (grid size, ion valence, ion concentration, boundary conditions, etc.) to match what is expected of the system (almost if not complete charge neutralization of the DNA) to the actual simulation results.

Reproducible Results!

So many dilutions! Endless labelling…

Last week, I repeated the equilibrium dialysis two separate times and prepared calibrations and dilutions for ICP.

I wasn’t able to run ICP until Monday since we ran out of Argon gas. I ran the ICP on Monday and Tuesday (only 2 runs because my samples were limited). After analyzing the data, we found that both dialysis runs showed 1 Na/S and nearly 1 K/S! I found a calculation error in the data analysis from last week which, when corrected, indicated that both Na and K samples had 1 ion for every 4 S. That dialysis was a “quick and dirty” experiment so we are more confident in the most recent data which has proven to be reproducible.

One thing that looks interesting is that the hydrodynamic radius of the nanoparticles goes down after salt dialysis and back up after water dialysis. After the water dialysis is can be up to 30 nm bigger than after the salt dialysis! Since the amount of PSS/NP is remaining constant, this data indicates that the conformation of the PSS is changing in response to the salt concentration.

Aggregated Nanoparticles

Going forward, we are going to run some tests with varying salt concentration. Today I did a titration of NaCl into the PSS coated NPs and took samples at a range of salt concentrations. I found that the nanoparticles aggregated (due to instability) partially at 100mM salt and completely at above 200 mM salt. This will give us an idea of what range we can dialyze the nanoparticles at.