When 30-day free trial comes to your rescue

For the past few days, I have been trying to figure out a way to average my data from the NanoAnalyze isotherms. I have tried using different ITC analysis programs to facilitate my work, but to little avail. I started off by downloading a series of ITC based software with some interesting abbreviations- NITPIC and SEDPHAT.

NITPIC can be used to extract the raw ITC data from NanoAnalyze to perform a number of functions including thermogram reconstruction and processing integrated isotherms from the raw thermogram. I ran a test trial using data from my 5mM DNA-Cobalt Hexammine data. The program succeeded in producing a beautiful isotherm for me. I then converted this isotherm into a format that is readable by SEDPHAT. SEDPHAT processed this data and subsequently produced a global fit. However, I still couldn’t figure out how to integrate this data with isotherms from my other trials, in order to generate an average fit for my data points. I played around with the program for hours to figure something out. But this is one of those stories without a happy ending.

NITPIC 

SEDPHAT

However, when there’s a will, there’s a way. I discovered another way to generate a mean isothermal plot. This process was lengthy and relatively complex.

I found a graph plotting software online that has been programmed to produce sigmoid fit for a data set. This software is called OriginPro 2017. I downloaded a 30-day free trial version of the program from a website. I had to average the area data from the “5mM DNA w Cobalt Hexammine” ITC runs using an Excel worksheet and I exported the mean results to Origin. I used the Boltzmann model of the Origin software to create a plot of the mean area data. Voila! There’s the sigmoid fit I wanted:
Sigmoid fit for the 5mM DNA isotherm. (And yes, the demo prints are due to the trial version)

Week 3 in a nutshell

Week 3 was more intensive than the previous two weeks. I lost track of the number of ITC runs that I performed over the last week.

I started week 3 by performing an ITC run with the same 5 mM DNA-NaCl solution from last week to check for experimental inconsistencies. The results displayed on the screen after 1.5 hours of continuous ITC humming produced well-consistent data. In order to stretch the plots between the binding and condensation phases even further, I created an 8 mM DNA-NaCl sample and ran it by the ITC machine. The integrated heat peak for the binding phase had been successfully stretched further after this ITC run, resulting in a larger number of plots between the phases. The experimental parameters were very similar in the two runs that I performed using the 8mM DNA-NaCl solution.

Furthermore, I also performed a second heat of dilution for the 6mM Cobalt Hexammine solution in order to account for one anomalous point in the first run. Subsequently, I subtracted this data from the other DNA-Cobalt Hexammine reactions in order to standardize the binding enthalpies involved in those reactions. This was week 3 inside the lab in a nutshell.

Outside the lab, we had an amazing time at the Tuesday brown-bag lunch. Everybody involved with the X-Sig summer research program on campus took part and we had our fair share of laughter and discussion there. On Wednesday, we had a dinner meet at the Quarry Pavilion. The food was amazing! I had a lot of fun outside work during this week.

The rest of week # 4 Preparation for new sample of chicken blood

The rest of the week I kept washing the chicken blood with KTM and Triton X-100 in order to wash away the fat surrounding the cell. In order to wash the blood, I used 20 micro-liters of KTM and 70  micro-liters of Triton X-100 for each sample and spin it in the centrifuge with a force of 3600xg for 10 minutes at 4 degrees Celsius. Throughout the day I just kept washing the chicken blood and made more KTM because I was running out. This process kept on going from Thursday to Friday because I still had red solution in my sample which is not what I was looking for. This process continued until I can obtain white/clean nuclei. On Friday I was able to see results from washing the chicken blood and I could see white/clean nuclei for two of my four samples. I ran the same procedure for the two solutions once again and I was finally able to get white/clean nuclei for all my solutions. Figure #1 shows how the chicken blood must look after all the washes with KTM and Triton X-100.

Figure #1 White clean Nuclei

After this was done, I once again wash the clean nuclei with just KTM in order to get rid of the Triton X-100. I did this procedure twice and by the time I was done the day was over. The washing of the chicken blood takes a good amount of time due to the amount of Triton X-100 that I added but for future reference I would recommend starting with at least 80 to 100 micro-liters of Triton X-100 and go down on the volume from there.

First Days of week #4 Trial and Error

I started out my week by once again doing the Trial Digestion chromatin due to the results we kept on getting from our DNA and Gel test. I started my work where I create samples with proteinase K, which contain 5 micro-liters of digested chromatin that I had previously created, 5 micro-liters of Proteinase K that professor Andresen recently bought, 0.5 micro-liters of SDS and for this new trial I added 0.55 micro-liters of CaC12 to the sample. After all this solutions where added, I let the samples sit for 50 minutes at a temperature of 50 degrees Celsius. While I was waiting for this to be done, I started preparing the gel once again. Once the gel was done, I placed the gel on the refrigerator for about 1 hour and 30 minutes. Figure one depicts the machine use to heat up the samples.

Figure #1 Isotemperature 

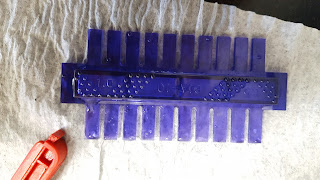
Once the 50 minutes were up, I took out the samples and placed them into ice. By this time I got new micro-centrifuge tubes and took 1 micro-liter of solutions from samples and added it to the new test tubes. I also added 9 micro-liters of 60% sucrose and 10 micro-liters of DI water. I did this for each sample that we had, and I also added 1 micro-liter of blue dye in order to see it once we added into the gel. During this time I also made DNA latter which contain about 4 micro-liter of DNA ladder and 10 micro-liter of 60% sucrose. During this time I took out the gel out of the refrigerator but notice that I used the wrong Comb! and this was really bad because due to this I needed to redo the gel and this took about the whole day. Once I was done making the gel I let it sit on the refrigerator though out the night. In my spare time I kept washing the new chicken blood with KTM. Figure # 2 displays the right comb to used for the gel.

Figure # 2 Comb used to make holes in the gel. 

The next day I came back, I took out the gel out of the refrigerator once again and this time I had everything  ready to go so I put my samples in the gel and used a machine to provide voltage in order to move the DNA from one side to another. This process took about 5 hours and in the mean time I kept washing the Chicken blood with KTM. Once I came back from lunch, my gel was ready to be view by a UV machine. My results showed a better improvement on the last trials but It still wasn’t good enough for what we were looking for. Now professor Andresen and I decided to redo everything from the beginning but this time we will used the new fresh blood that was bought recently  and see how this results come out and compare them our previous results. We aren’t so sure why our results came out the way they came out but we are thinking it might have been with storing our chicken blood in the -80 degrees Celsius refrigerator might have something to do with it. I guess this is part of being a researcher, to keep trying and improving on previous results in order to progress and grow both has a researcher but also has a human being.

Week #3 Results from our chromosomes

Week # 3
I started out my day by making 500ml of 10mM Tris and 1Mm CaCl2 at 4 degrees Celsius with stirring.
Took our solution from previous week and split it into two test tubes to get it ready for the centrifuge. Once both solutions were measured, I spun it at a speed of 5000xg for 5 minutes in the Centrifuge machine located in the Science center.
Once this was done, I removed the supernatant from each of the two test tubes. I removed 10ul of solution from each test tube and added 930ul of DI water to use UV-VIS machine. Calculated A260 and A320 wavelength for each solution and its absorbent at that wavelength. 

 After this was done, professor Andresen used the same techniques with the dialysis bag and dialysis clip to add the supernatant and store it. Once this was done, we placed the dialysis bag with the supernatant inside to the 500ml of Tris and CaCl2 that we created early today, and placed this solutions into the refrigerator for the day.
When this was done, I calculated the grams of chromatin and DNA that we had in both our solutions.
The next things Professor Andresen and myself did was to create the Agarose Gel, which is used to separate varied sizes of chromosomes. When making a solution of agarose and TBE buffer we must be careful to not let it stay still and always mix it around because if we let it stay still, it will get frozen and then we will have to start again. This process approximate took about the entire day and once the gel was done we placed it into the gel cast and put it in the freezer overnight.
The next day when I came back, I calculated the DNA concentration of our Tri-Digestion. Once this was done, I used the information from the UV-Vis information to calculated how much NE stock volume to add to our solutions. I created an excel chart to calculated all the NE stock volume in one go, once this was done I added all the solutions I need to such has 100x Deluded Micrococcal to eat up DNA strands and heated to a temperature of 37.5 degrees Celsius for 55 minutes. 

Figure 1# Machine used to heat up solutions
 When this was done I got the gel ready that we made yesterday and place it in a place where we were going to add our samples. Once we took our solutions from the heater we took out 5ul of chromatin, 5ul of proteinase and .5ul of SDS into new test tubes and once again place this into the heater for 50 degrees Celsius. Once this was done, professor Andresen carefully poor the new solutions into the gel and used a machine name EASYcast BIA which pours electricity into the gel, which has a positive and negative charge and tends to move the DNA from the left to the right since DNA is negatively charge it will tend to move to a positively charge. This process approximately takes about 3 to 4 hours until you see a blue color line reach 5cm in the gel and once this has reach that point we place it into a special UV light that will tell us where the 146 chromosomes are. 

Figure #2 Blue line where it needs to stop once DNA moves to the right due to charges.

Figure #3 Shows the line where you must fill gel with TBE buffer

The results we got were not the ones we were expecting so I came back to the laboratory and prepared to do the gel again and solutions to continue the next day.
When I came back the next day, I went to a training section to use a machine called UNICORN which took about half the day which I wasn’t expecting. This machine is going to be used to complete many task and one of them will be to use by our lab group. After this was done, I finish my day off by spinning more chicken blood in the centrifuge and creating gel once again for another try. I prepare everything to do the gel test once again for the next day and that’s all that my day consisted off.
The next day came and we did the same procedure with the Agarose gel, placed the solutions on the gel and used once again 100volts to move the DNA to the other side of the gel, and waited out for about 4 to 5 hours until a blue slash line reached the 5-cm mark. Once this was done we put it into a UV light to see how our results come out, unfortunately our results were not what we expected once again because we couldn’t see the separation of chromosomes. This can be seen in figure #4. 
Figure #4 Results from UV light and our chromosomes
This took approximately half the day and the rest of the day I just continue to spin down chicken blood with KTM in the centrifuge. Next week we are replacing our Proteinase K during our Trig-Digestion because we believe this is changing how our results come out. We will due the same procedure and double check on what could had cause our results. 

End of Week three!

Since my last blog post I have not been able to move forward from the equilibrium dialysis step. I have restarted back to square one twice since then. However, we are continuing to struggle with this step. On the last run we got one of the four samples to actually provide sufficient data so currently I am trying to run eight samples in order to get more sufficient data. I’ve also been heavily experimenting with running the centrifuge at different speeds to see if that could help optimize the data. I am also eternally grateful for professor Andresen setting up his centrifuge machine in our lab. This saves me from sprinting back and forth from the science center and Masters Hall a hundred times a day. When we switched machines however, I had to figure out the RCF (relative centrifugal force). Where two machines at the same rpm can provide varying forces on the things inside, RCF is constant between everything. So after switching machines I upped the RCF by about 1.5x per run, in order to see if this would yield better data. I could then run the supernatant or sample in  UV-Vis machine to see where both the gold and DNA was and had gone too. This allowed us to conclude that spinning at 3900 RCF was the best option for us right now. With my current eight samples that I’m using, I initially spun all eight of them, but spun four of them an additional time before taking the supernatant off and re hydrating. When we finally get data this should allow us to see which method works better. I have another spin or two to finish by the end of today but I am hoping to start Monday off with getting some great data!

Week #2 Preparation of Mononucleosomes

I started my week by getting my hands in chicken blood that I was going to used to extract its DNA and prepare mononucleosomes. The amount of chicken blood that I got from a refrigerator at -80 degrees Celsius  was about 50 mL of blood solution and 25 mL of blood cell volume. Then I added KTM with PMSF (Used to keep proteins from destroying the cell)  already added in the KTM to have a total of 100 mL of blood and KTM, after this was done I split the solution inot 4 x 25 mL solutions. This can be seen in figure #1.

Figure #1 Chicken blood and KTM

After these solutions where made, I had to measure their weight and make sure all of them weight the same mass, this needs to be done in order to used the Centrifuge machine. The centrifuge machine works by spinning solutions at high speeds which makes the gravity increased around the solution and helps separate liquids that have different weights. For our solutions, this process separates blood cells from plasma cells. Since we separated our solution into four different blood samples we only needed to get he same weight for each of them and placed two solutions on each side in order for the solutions to be balanced in the Centrifuge. If for some case we only have one solution, we need to used water has our other sample in order to used the Centrifuge and have a balance sample. Once we spin our sample in the Centrifuge at 3900xg for 5 minutes and then removed the supernatant carefully. The supernatant is the liquid that is on top of the nuclei which is shown in figure #2.

Figure # 2 Supernatant after spin

I did this procedure four times, and after this was done I added 0.2% of Triton x-100, which is a substance used to wash away the fat surrounding the cell. Then we spin the solutions in the Centrifuge at a speed of 3600xg for 10 minutes at a temperature of 4 degrees Celsius. When this was done we incubate for 30 minutes on ice while turning the tubes every 5 minutes. This process took the whole day, and so after all of this was done we placed it in the refrigerator and came back to it the next day.

The next day came and I did the same process has the previous day, I measure the mass of the four solutions we had and added Triton x-100 to wash our solution once again. I repeated this same procedure until I obtain white/clean nuclei. This can be seen in figure #3.

Figure #3 White/Clean nuclei

 One I got this results, I added the four solutions into two test tubes and removed all supernatant. On this two test tubes I added KTM which includes PMSF in order to wash and get rid of the Triton x-100, and I did this twice. When using the Centrifuge, I set it to 3600xg for 10 minutes each time. When the washing was done, I added 8mL of ML and spin it at 3000xg for 5 minutes at a temperature of 4 degrees Celsius. I did this process four times and each time I measured the mass of each test tube in order to use the Centrifuge. This process once again took the whole day, so after I was done with this, I placed the solutions into the refrigerator.

The next day I took 2 small samples of the solution and used the UV-VIS in order to determined the DNA concentration, we used the wavelength of 260 and 320 and determined its absorbent.  In the beginning I was having trouble with the UV-VIS because of issues with the computer software, the problem was solve by restarting the computer once again. This procedure took about two days just because myself and Professor Andresen weren’t sure if the data was correct. Once again we did this procedure by taking 10uL of nuclei from our solutions and then adding 930uL of H2O and then adding 50uL of 2M NaOH and 10uL of SDS. Our results can be seen in figure #4.

Figure #4 

Once we got this results, I re-suspended the nuclei in 15mL of ML and PMSF, and split it into 7mL in each 15 mL tube. This solutions were then spun at 3000xg for five minutes at 4 degrees celcius and discarded the supernatant once again. This was done three more times.  When this was done I needed to bring our solution to a temperature of 37 degrees Celsius. Since our nuclei was about 18 to 19 mL, I needed to split it into 4.5 15mL tubes in order to fit it into the Iso-temperature machine, and this was left in the machine for 10 minutes. Once the 10 minutes were off, professor Andresen added 8.3uL of Micrococcal nuclease and we let it seat in the machine for 30 minutes. After the 30 minutes, I added 368uL of EDTA in order to stop the reaction of cutting the DNA. I ice it for 10 minutes and then pour the solution into one test tube, proceeded by placing it into the centrifuged for 5 minutes at a speed of 1000xg at 4 degrees Celsius. I took out the solution from the centrifuge once it was done and I removed the supernatant and kept it. I also made 500mL of EDTA with a concentration of .250uL of EDTA and the rest was water. The next part was done by Professor Andresen because it takes a lot of skills and precision to get it right on the first try. He used Dialysis clip and Dialysis tubing to create a sort of bad for the nuclei to rest at. The dialysis bag is used to let liquid through but not anything else, once this bags were created, they were placed into the 500mL of EDTA and left overnight on the refrigerator.
Friday I started my day by getting training in laboratory safety procedures and then once this was done I headed to the lab. Once I got into the lab I took out our solutions from the refrigerator and from the EDTA that was placed in and pour it into two tubes. I took out a small sample from each solution to see how much DNA concentration we had and we did this by using the UV-VIS has previously done. Once the concentration was found we put our solutions into a stronger centrifuge in order to spin it to a speed of 8000xg for 20 minutes in order to spin down the foggy membranes and debris. When this was done, we should had 80-90% of the total post-digestion DNA in the supernatant and the other percentage in the pellet. I combined the two supernatant from both solutions into one tube and added concentrated stock to make 50mM of NaCl. We placed our solution into a beaker with a spinner and left it stir it slowly at 4 degrees Celsius for the weekend. We will check back at our results in the next week.

Week 2- More ITC stuff

For those of you wondering, here’s what the TA Nano-ITC instrument really looks like!

I had a disastrous start to week 2. On Monday, I was in bed for most of the day with a flu. However, things started to pick up on Tuesday. I started off by running the ITC machine on the DNA sample that I made last week. My job was to make the 3mM DNA-NaCl solution react with the 6mM Cobalt Hexammine solution(also made last week) and record the enthalpy changes that signify the two binding phases of DNA, i.e. the binding of DNA with Cobalt Hexammine and the subsequent condensation of the DNA molecule.

I started my experiment by loading the Nano ITC device with the reactants. I loaded the sample cell of the ITC machine with 300 µl of the DNA solution. Next, I loaded the buret syringe with 50 µl Cobalt Hexammine. The process of loading the buret syringe was extremely difficult and stressful the first time. I had to make sure that there were no air bubbles present in the Cobalt Hexammine solution contained in the syringe column. Not only that, I had to poke in a air bubble at the top of the liquid column using the plunger. I remember sweating profusely while desperately trying to pipette air bubbles out of the column! That was a time consuming process.

The next part was pretty straightforward.

 I just used the ITCRun software installed in the computer connected to the ITC device to operate the machine. I basically set all the parameters required for the reaction to proceed and the software did the rest. After equilibrating the sample solution for about 30 minutes, the ITC started emptying the Cobalt Hexammine,bit by bit, into the sample cell after regular intervals of 175 s. At the same time, the software plotted and recorded enthalpy peaks after every 175 s. 

Sadly, my first trial was a massive fail with the first few plots going horribly wrong. I’m assuming it was due to the presence of a massive air bubble at the tip of the syringe. 

Results from run 1

I re-ran the experiment with the same settings for a second time. Didn’t work this time either!
When you fail, you have to try harder. That’s what science is all about.
So, I reset the experiment for a third time and started the experiment with fingers crossed. And it worked this time!

Result from run 3

I re-modeled the raw data using the NanoAnalyze software to display the thermodynamic parameters involved with the experiment. This was necessary to prove the presence of two distinct binding phases of DNA. 

Remodeled data from run 3

In order to ensure consistency in the data I ran the experiment once more. The results from this run looked similar to the results from the third. Hence, this run was successful too!

Our next objective was to create a broader spectrum of peaks in between the two binding phases of the DNA. In other words, I had to figure out a way to shift the sigmoid curve towards the right and magnify it. I used the simulation mode in the NanoAnalyze software to devise parameters that would enable us to meet this requirement. I won’t go into details about how this simulation mode works. But here is a model that the simulation mode prepared for us:
 It recommended that I use a 5mM DNA solution for my next ITC run. I made a 5mM DNA-NaCl solution by dissolving 16.7 mg of calf thymus DNA in 10 ml NaCl. 
I ran this new DNA solution in the ITC with the 6mM default Cobalt Hexammine solution. Here are the results so far:

Results from 5mM DNA w 6mM Cobalt Hexamine run 1

The raw heat data displays a wider range of peaks between the binding phases. Hence it is safe to say that the experiment was successful. To confirm this, I remodeled the raw data using NanoAnalyze:

A perfect match with the experimental model from the simulation mode! 
This week has been an eventful one. Starting off with a few bad trials, I was eventually able to make things work and obtain much better results. A great end to week 2!

Week #2 MTW

So like I last mentioned, I did start off Monday by characterizing the DNA in Professor Thompson’s UV-Vis machine. The peak wavelength was at 527nm, this is a good sign. A solution with this peak wavelength indicates that the majority of the gold nano-particles are the size and shape that we want them to be. I then used a quartz cuvette in the UV-Vis machine to examine the DNA. The peak was then at 258nm which is a good place for the DNA’s peak to be. We also recorded the wavelengths at 260nm and 320nm. This was done because subtracting the 320 wavelength from the 260 wavelength can allow us to calculate the concentration of the DNA in the solution.

Next I began preparing for equilibrium dialysis. First I prepared some TEM buffer, which is like TE buffer but slightly different. It contains NaCl, Tris, EDTA, and water. This would be what is used to re-hydrate the solutions during dialysis. Then I did more calculations to find the proper ratio to mix the DNA and gold nano-particles together. Unfortunately (?) something must have gone awry, for the DNA and gold nano-particle solutions (which all SHOULD have contained exactly the same thing) looked very different.

It’s very clear that these solutions are not all the same. We decided to re-run these samples in the UV-Vis to try to identify where things had gone wrong. The UV-Vis showed us that the samples were all relatively the same, so we continued to equilibrium dialysis. For equilibrium dialysis we use big centrifuges located in Professor Thompson’s lab. The procedure calls for 40 minutes at 3000rpm. Unfortunately, I ran the first 40 minutes at 3000rpx (?) which is roughly 5000rpm. This is much more forcible then what should be used, and likely caused the DNA to crash out. After the first spin it looked like this:

To me, this looked pretty normal. The pellet is not very big, but is definitely noticeable. The supernatant was then siphoned off and the solution was rehydrated with TEM buffer. The second run, I was sure to set it at 3000rpm for 40 minutes. After the second run the solution looked like this:

It is very noticeable how small the pellets are and this concerned me. I then siphoned off the supernatant and re-hydrated the solution with TEM buffer and ran the solution at 3000rpm for 40 minutes in the centrifuge one last time. After this last run, the pellet was almost unnoticeable. Regardless, I siphoned off the supernatant and re-hydrated the solution. Because the pellets were so small on the second and third runs, we figured that something was wrong. To try to find what had gone wrong, we decided to run everything in the UV-Vis machine again. After getting the results back, it appears that the first run at 3000rxm had in fact caused the DNA to crash out.

Week #1

Introduction to Lab requirements and goal

The first week working with Dr. Andresen was a great success and great experience. We started our Research with a basic understanding of what our goal was and proper ways to work in an environment where all data must be collected and solutions must be carefully made.

Monday, May 15, 2017

On Monday I met with Professor Andresen and his summer research group to discussed the plan and the goal for the research that we are investigating. We went over the basic requirements that we need to accomplish such getting keys to lab room so we can have access when Professor Andresen can’t make it. We also went over the websites that our group must used in order to keep track of our progress and find preparation guides for solutions that we might need in the near future. This website is called lab wiki and we can find useful information on how to specifically do a solution and it also gives us the freedom to create our own page where we can post a guide on the techniques that we used to create a specific solution. I was given Abby’s and Sarah’s work book to gather information on their procedures and work done previous summer’s. I was also given articles and books related to the cell and specially Nucleosome Core Particle to learn more about how the cell works and the role of DNA.

Tuesday, May 16, 2017

On Tuesday I made 50ml of 1 Mole stock of Na-Cl which is about 2.922g. After creating this solution I added the Na-Cl into a disposable container  of 50mL and label it with the name of the solution, my initials and the day it was created. This was also done to 1 M of Magnesium Chloride hexahdrate and I used 10.165g of stock  creating 50ml. After creating this solution I went to the wiki page and look for the preparation of Tris-HCl. Printed our the instructions and taped them into my workbook, and I made the solution following each step with the help of Professor Andresen, since I was dealing with powerful acid that I wasn’t used to work with. This was done through out the day, seeing how I was learning how to used the proper techniques and tools to complete each task, this was all done with the help and guidance of Professor Andresen.

Wednesday, May 17, 2017

I started out my day by creating 50ml of EDTA with about 1/2 molar, this translate to 9.3004g of stock. On this day Professor Andresen added NaOH to get the content to an pH of 8.0. While the Professor was doing this, I was left the task to make 500ml of KTM, Ml, and DB solutions. Each solution contain different components such has Tris-HCl, NaCl, and MgCl2. The procedure in making this solutions can be found in documents provided by previous research members. This solutions and data took the entire day, careful measurements were made and tools used were washed to keep a clean laboratory and environment.

Thursday, May 18, 2017

I was left with the task to make more Tris-HCl with pH of 7.5. From what I learned from Professor Andresen, I took careful measurements of the amount of HCl I added to the Tris-HCl in order to control the pH to be 7.5. I also was very careful in handling HCl, by wearing protective gloves and plastic glasses. After creating 50ml of Tris-HCl, I added the procedure to make EDTA onto wikipedia. After this was done I helped Dylan when using the UV-VIS machine, but we encounter some software problems that created problems in our solutions for the nano-particles. The time I had between projects, I read over all the documents that I still had from Professor Andresen, and read more about the structure of DNA in a cell.

Friday, May 19, 2017 

On this day we started by having a group meeting with Professor Andresen and my colleagues. This group meeting was to inform Professor Andresen about our progress in our work and an overview of what we had done during the week. On this day we also got information on software that will be helpful in future research of scientific articles and citations. When this was one, my colleagues and I went to the Science Center to shred DNA and we took careful notes on every step we did. When this was done we launch the DLS machine and got results from the nano-particles with used. During this time we also got more nano-particle from last summer that Savana was using, and to finish the day off I spend relocating the nano-particles into new containers and reading useful articles that Professor Andresen provided, in order to prepare for next week.