


Hello again. It’s Matt back with some progress updates on my research. For starters, I got it working!
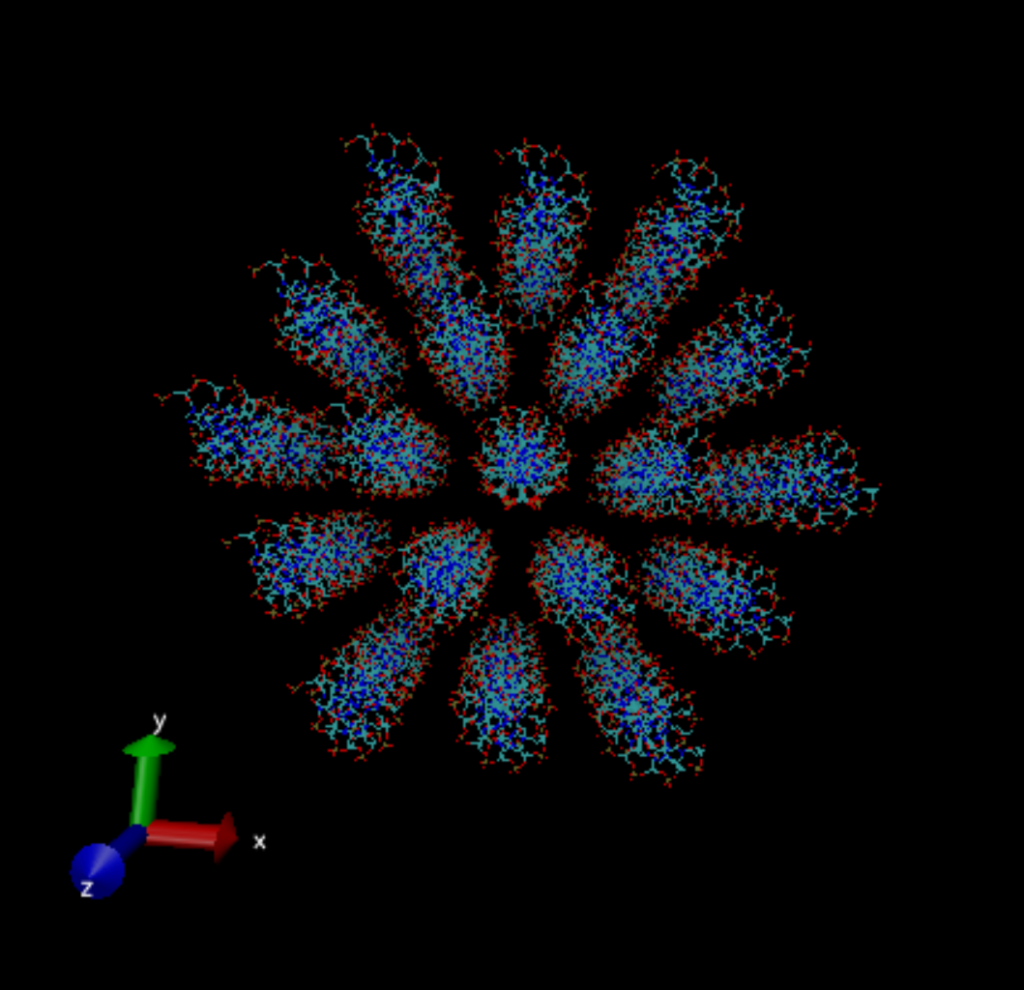
As a reminder, the purpose of doing this is to simulate a single strand of DNA, the one in the middle, as if it were in vitro. Since we can’t simulate the entirety of a strand of DNA (it’s far too large), we take a small portion of it and hope that the insights we glean can be applied, or at least give us some insight into the whole DNA strand. There is also a slight change that you may have picked up on: the DNA has been rotated around the y-axis. This is purely for our sake in doing the analysis; it’s challenging as-is to work with 4D data sets (after we run the DNA simulation through the online web server that does all the math for us we get back data that when we plug it into matplotlib we get a 4D data set: the x, y, and z coordinates as well as the electric potential at all points), adding in another level of complexity in having to consider the x-axis as the z-axis, for instance, just adds needless confusion. It took me about two days to implement this rotation as the way I attempted first was to essentially make another function in my program that rotates the coordinates of the original DNA strand before I copy it everywhere. Unfortunately, rotations in 3D are hard and I couldn’t get it working. Luckily, I found something online that simplified the work a ton: the program we’ve been using to visualize the DNA (where the picture came from), VMD, actually allows you to change the locations of the DNA and spit them back into the original file. With 6 lines of code, the DNA strand was rotated and I could use my original program with no edits.
Now, our goal is analysis. I mentioned above that we will be using matplotlib, a graphing package for Python, in order to accomplish this. Basically, what we want to do now, is take the big long sheet of electric potentials that we have at every point in the simulation and trim it down to only the data we care about: the data inside a smaller-than-the-small-hexagon (i.e. inside a 28nm radius hexagon centered around the central DNA strand). Again, our goal is to simulate this singular DNA strand; the rest of the data isn’t representative of this goal and can be ignored for our analysis, the only reason it exists in the first place is because the potential at a given point depends on the potential at all the points around it. Once the data we want is selected (which is probably the hardest part of the rest of the project, 3D plots in matplotlib are no joke) we can then do some math on our end to figure out the excess number of ions that are present around the DNA strand according to the Poisson-Boltzmann equation. If you remember from the last post, this is the entire point of the project! If we can get the number of these ions we can begin work on publishing the paper and the sweet sweet publishing credit can be added to my resume! One step at a time, but every step forward is one step closer to grad school.