


Professor Andresen’s lab is back up and running for the 2023 season and we have a great team joining us this summer! Sofia is returning to work on her project of Measuring Zn2+ Binding to DNA, while I have taken over Aisha’s project of Measuring the Kinetics of the Disassembly of Mononucleosomes and Aubrie has started work on Tam’s old project on The Entropy and Enthalpy of DNA systems. Also, Aston has joined the lab to work on Simulating Cobalt Hexammine3+ Binding to DNA. So far, things are looking great for this new team of researchers as they begin working in the lab.
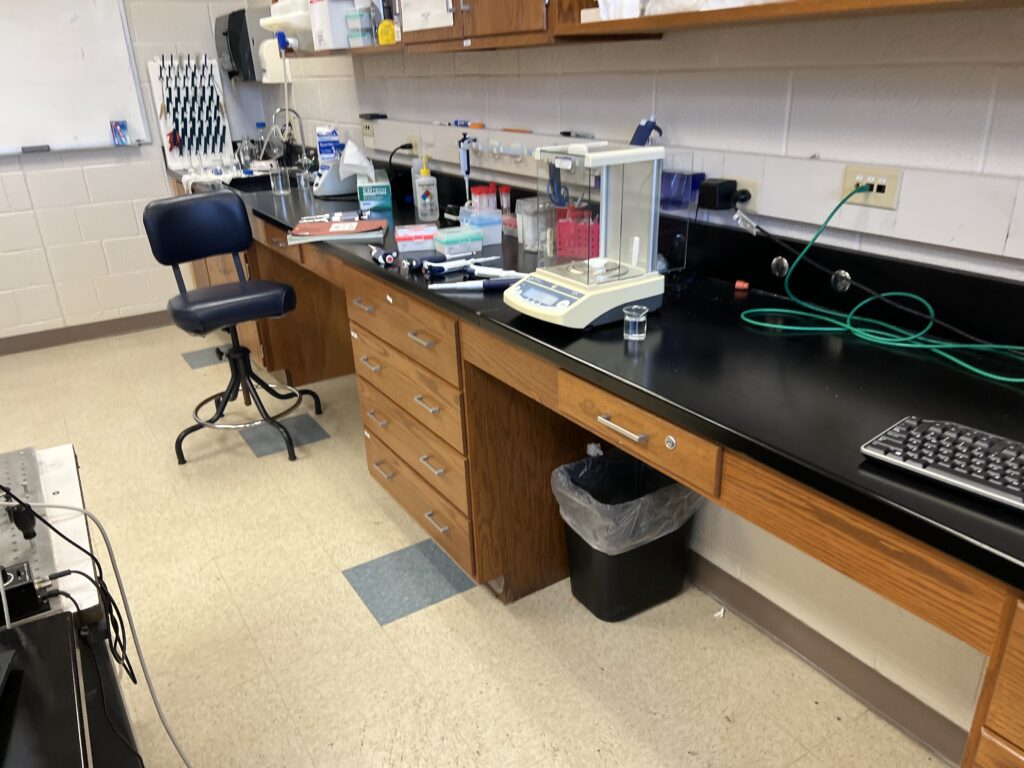
First things first, the team learned expectations and safety measurements taken in labs. After, we all toured the different labs that we will be using, and learned about the important equipment that will be used in future experiments. Then, we all learned pipette techniques and how to properly handle basic lab equipment, such as tubes, flasks, and scales.
We then made salt solutions using all the techniques we were just taught. Surprisingly, we only broke one volumetric flask! Fortunately, this was the perfect chance for us all to practice safety while cleaning up glass and how to properly dispose of it. What a great learning experience!
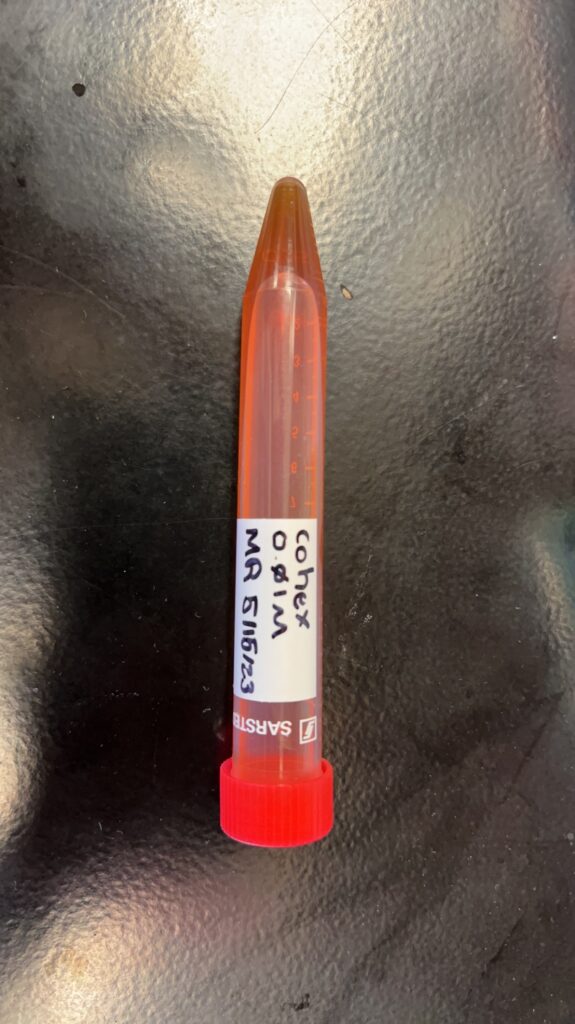
On Tuesday, we replicated a DNA aggregation experiment. To start, we made a solution of DNA with a buffer, water, and a pinch of salt—a great recipe if you’d like to follow along at home. In our experiment, we gradually added more and more Cobalt Hexammine to our DNA solution and recorded the aggregation of the DNA.
To record such data, we learned about and used the NanoDrop. The NanoDrop is a special measuring tool that takes in only a little bit of the sample and can tell how much the DNA has aggregated.
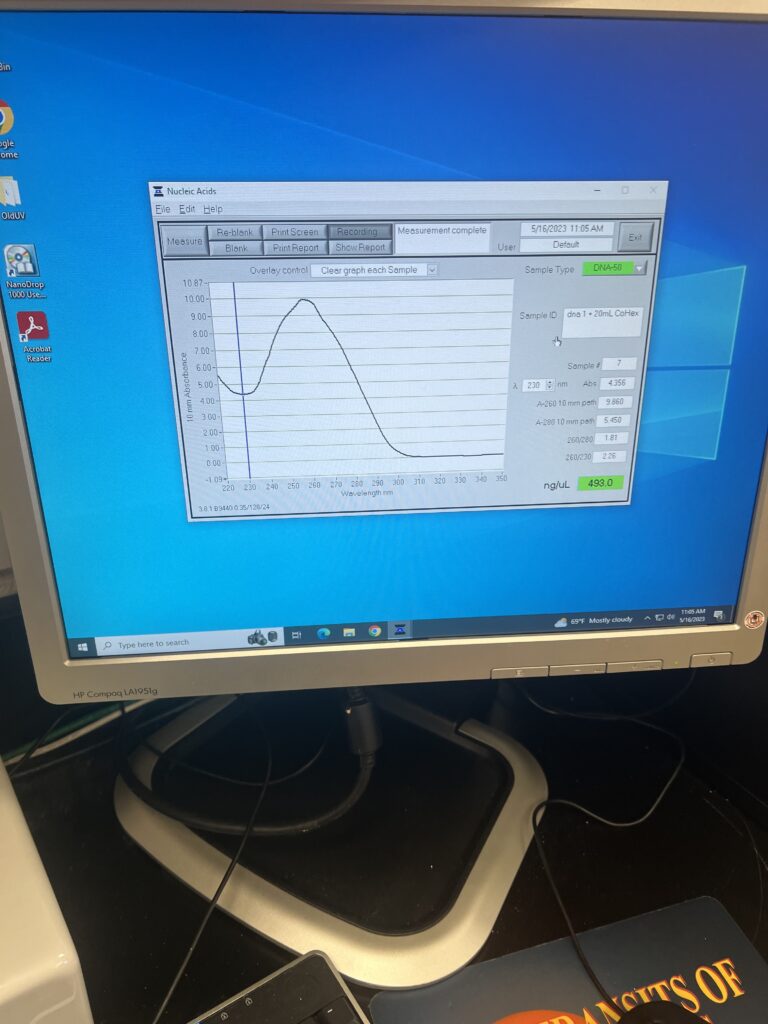
We made two samples to record our data and we were able to replicate the results of the experiment.
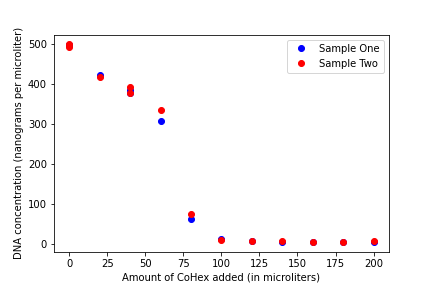
We can see from the graph that the concentration of DNA decreases as the amount of Cobalt Hexammine (CoHex) is added to the samples. These are the results that we expected to see in our experiment, as they match the results begotten from the original experiment that we were replicating. Also, on Tuesday, we all had lunch together at Montezuma and it was very fun. I would highly recommend it.
Wednesday, we made three samples of DNA solution with increasing amounts of Zinc. Our goal was to use CD (Circular Dichroism) Spectroscopy to see the changes in the structure of DNA.
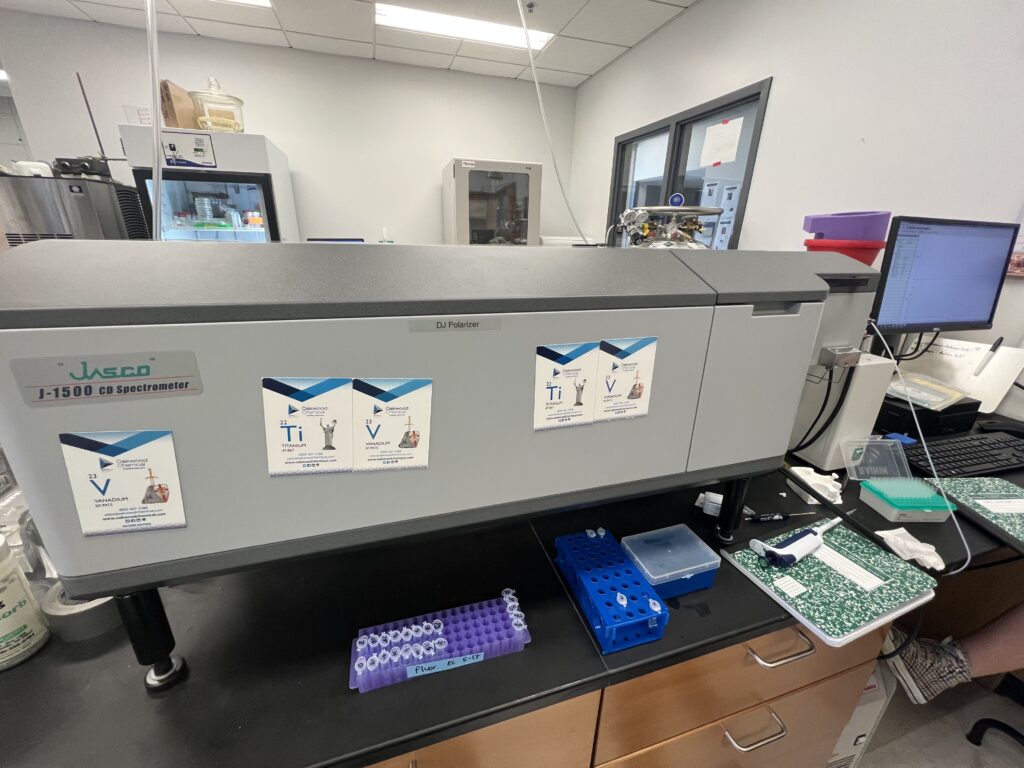
The CD does this by shining polarized light through certain molecules at different wavelengths. We were trained on the CD, and then we learned how to use Jupyter to plot our data and better analyze it.
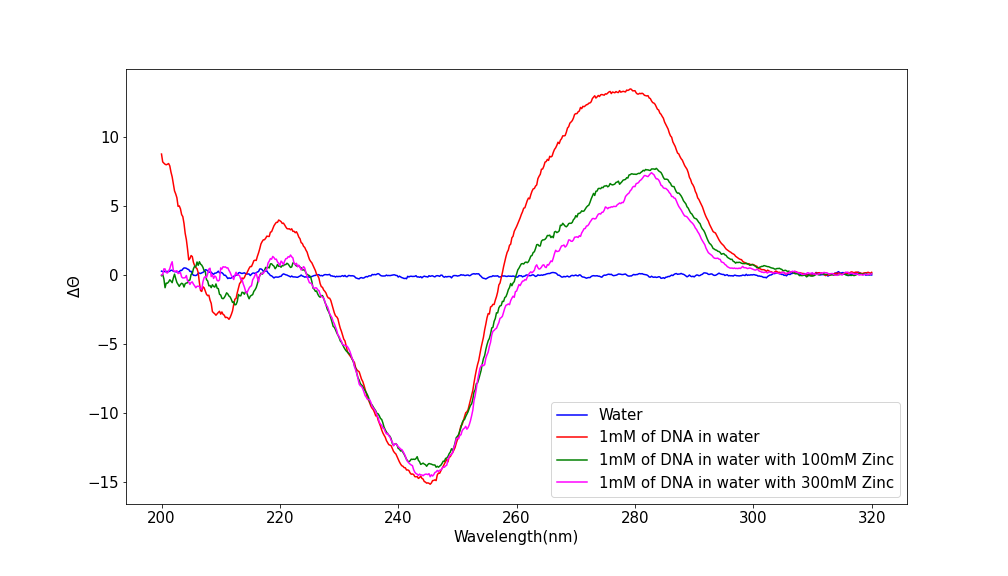
Our graph shows the shape of DNA with varying levels of Zinc added. A baseline` of water can also be seen. We can clearly see that DNA’s shape is affected as more Zinc is added, though the general shape of the graph remains the same.
On Thursday, we got trained on both the ICP and the ITC. Before all that, though, I washed a few dirty dishes in the lab, because a clean lab is a good lab! However, I noticed that our water was running low, so Aubrie and I went to go get some more. Unfortunately, we soon realized that our tank was cracked. After making a few small puddles in the lab, we borrowed another tank and replaced the old one. Then, we were able to move on to training. The ICP, which we got trained on first, is the Inductively Coupled Plasma Optical Emission Spectrometry.
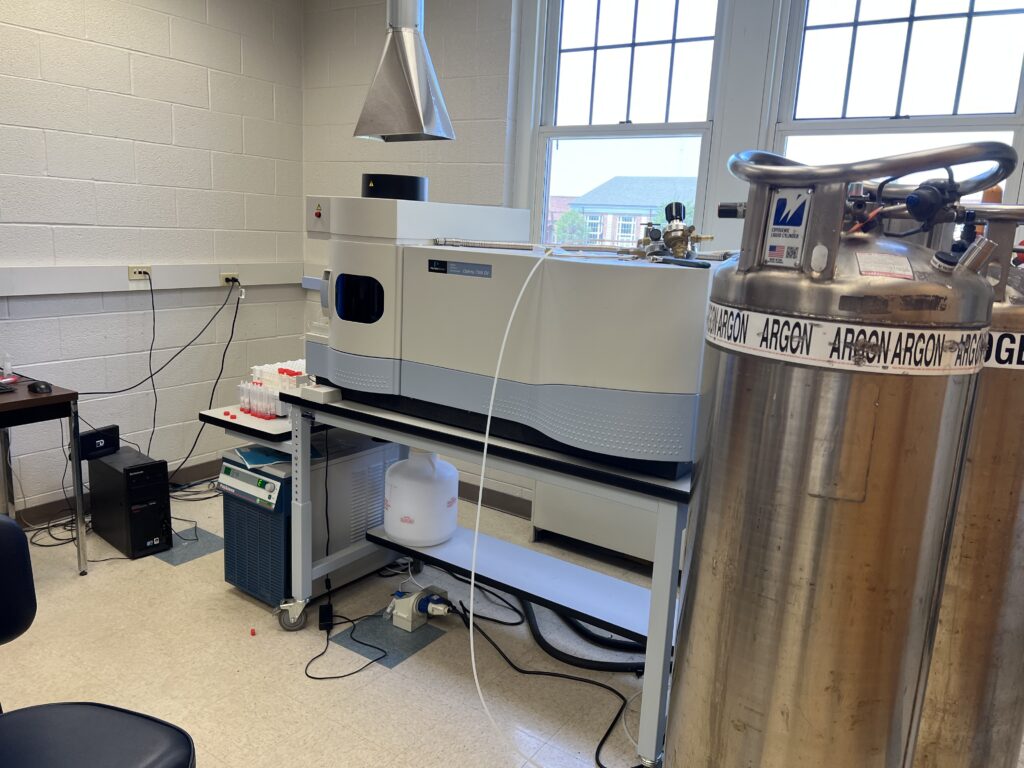
It takes a sample and sprays it into plasma, which then breaks chemical bonds and excites the electrons in the element. When the electrons move states, they emit light. The machine takes in this light’s wavelength and can tell, since this wavelength is element-specific, which element is in the sample. Next, we got trained on the ITC, or the Isothermal Titration Calorimetry, which measures the binding constant, the enthalpy, and the stoichiometry of samples. We can also use these measurements to calculate free energy and entropy. We also held a milk and cookies social for all the researching students on campus, which was a ton of fun!
We all look forward to the rest of our week and the rest of our experience this summer! We hope to make great progress in all our projects and, of course, have a decent amount of fun.
Until another glass breaks,
Macyn.